|
|
|
|
|
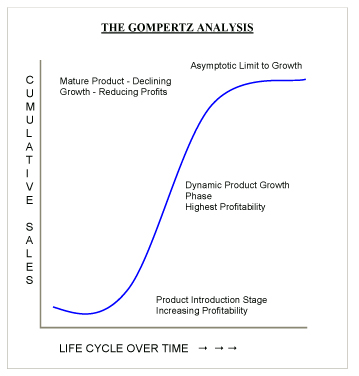
There are three Life Cycle stages for Products & Services , these are as follows:
Market Segmentation
PROFITABILITY / HIGH MARKET SHARE / PRODUCT UNIQUENESS
For the Company, product uniqueness and a high relative market share will
tend to find that they experience a reduced profitability.
The relative selling prices for Products & Services in the Trade Cell are shown below. In certain markets prices are substantially at variances with the average pricing in the Trade Cell. These relative prices have been corrected for, and exclude, the effects of inflation, discounting, relative buying indices, et cetera; but including the effects of unavoidable taxes, duties and other levies. Thus the data below represents the actual cost of products and services in real terms and net of the effects of other extraneous factors.
Index of Pricing over Time
[ CORPORATE DATABASES: The section marked in the data indicates the average selling price for Products & Services marketed by the Company. This will show the relative price differential between the Company's prices and the various price norms. ]
Long-Term Product Price Cutting Effect
Short-Term Price Increase Effect
Long-Term Product Price Increase Effect
PRODUCTS + SERVICES QUALITY
RELATIVE
PRODUCTS + SERVICES QUALITY IN THE TRADE
CELL
Index of Quality over Time
[ CORPORATE DATABASES: The section marked indicates the average quality for products and services marketed by the Company. This will show the relative quality differential between the Company's product quality and the various quality norms. ]
PRODUCTS + SERVICES QUALITY It is essential for the
Company to be fully
aware of the importance and criticalness of Products & Services Quality. HQP-LQP
Where,
HQP = % OF SALES FROM HIGH QUALITY PRODUCTS LQP = % OF SALES FROM LOW QUALITY PRODUCTS
CIRCUMSTANCES WHERE ROI IS GREATER THAN THE INDEX
QUALITY / PROFITABILITY & CONCENTRATED MARKETS
The
benefits of producing high quality products are most dramatic in highly
concentrated market situations.
PRODUCTS + SERVICES QUALITY & RELATIVE MARKET SHARE
PRODUCTS + SERVICES QUALITY / PROFITABILITY & MARKET GROWTH
High Products & Services quality is essential to profitability during low market growth periods.
Quality Improvement
| ||||||||||||||||||||||||||||||||||||||||||||||||||||||||||||||||||||||||||||||||||||||||||||||||||||||||||||||||||||||||||||||||||||||||||||||||||||||||||||||||||||||||||||||||||||||||||||||||||||||||||||||||||||||||||||||||||||||||||||||||||||||||||||||||||||||||||||||||||||||||||||||||||||||||||||||||||||||||||||||||||||||||||||||||||||||||||||||||||||||||||||||||||||||||||||||||||||||||||||||||||||||||||||||||||||||||||||||||||||||||||||||||||||||||||||||||||||||||||||||||||||||||||||||||||||||||||||||||||||||||||||||||||||||||||||||||||||||||||||||||||||||||||||||||||||||||||||||||||||||||||||||||||||||||||||||||||||||||||||||||||||||||||||||||||||||||||||||||||||||||||||||||||||||||||||||||||||||||||||||||||||||||||||||||||||||||||||||||||||||||||||||||||||||||||||||||||||||||||||||||||||||||||||||||||||||||||||||||||||||||||||||||||||||||||||||||||||||||||||||||||||||||||||||||||||||||||||||||||||||||||||||||||||||||||||||||||||||||||||||||||||||||||||||||||||||||||||||||||||||
|
INDUSTRY TRADE CELL RELATIVE NEW PRODUCT INDEX
|
The above chart shows relative Trade Cell
New product Introductions for products and services. The mid-point line,
indicated as '100' represents the Trade Cell average for New Product
Introductions of Products & Services.
PROFITABILITY / MARKET GROWTH & NEW PRODUCT INTRODUCTIONS
|
PROFITABILITY / MARKET GROWTH & NEW PRODUCT INTRODUCTIONS |
||||
|
THE TARGET COMPANY |
NEW PRODUCTS AS A FUNCTION OF TOTAL SALES |
|||
|
LOWER |
SAME |
HIGHER |
||
|
LONG-TERM REAL TERMS MARKET GROWTH |
LOW |
ROIc=****% |
ROIc=****% |
ROIc=****% |
|
MEDIUM |
ROIc=****% |
ROIc=****% |
ROIc=****% |
|
|
HIGH |
ROIc=****% |
ROIc=****% |
ROIc=****% |
|
The higher the overall long-term market
growth the more damaging is the effect of the Company new product
introductions on profitability. Thus if the market is growing rapidly there
will be a dramatic decline in profitability if there is also a high
incidence of new product encroachment.
If however the forecasted
market growth rates are relatively low then a high incidence of the Company new product introductions will not too adversely affect overall
profitability.
NEW PRODUCT INTRODUCTIONS / INFLATION & PROFITABILITY
|
PROFITABILITY / MARKET GROWTH & NEW PRODUCT INTRODUCTIONS |
||||
|
THE TARGET COMPANY |
RATE OF INFLATION |
|||
|
LOW |
AVERAGE |
HIGH |
||
|
NEW PRODUCTS AS A FUNCTION OF TOTAL SALES |
LOWER |
ROIc=****% |
ROIc=****% |
ROIc=****% |
|
SAME |
ROIc=****% |
ROIc=****% |
ROIc=****% |
|
|
HIGHER |
ROIc=****% |
ROIc=****% |
ROIc=****% |
|
If the Company experiences a low level of
new product introduction they will suffer in terms of overall profitability
in periods of high price inflation.
With a relatively high level of
new products introductions the company may actually experience
an improvement in profitability during period of moderate price inflation;
however this effect will tend to be reduced during periods of higher price
inflation.
NEW PRODUCT INTRODUCTIONS / INVESTMENT IN NEW PLANT + EQUIPMENT & PROFITABILITY
|
NEW PRODUCT INTRODUCTIONS / INVESTMENT IN NEW PLANT & EQUIPMENT & PROFITABILITY |
||||
|
THE TARGET COMPANY |
REPLACEMENT VALUE / ORIGINAL COST OF P + E |
|||
|
LOW |
AVERAGE |
HIGH |
||
|
NEW PRODUCTS AS A FUNCTION OF TOTAL SALES |
LOWER |
ROIc=****% |
ROIc=****% |
ROIc=****% |
|
SAME |
ROIc=****% |
ROIc=****% |
ROIc=****% |
|
|
HIGHER |
ROIc=****% |
ROIc=****% |
ROIc=****% |
|
A company experiencing a high level of
new product introduction coupled with New Plant & Equipment
investment will suffer in terms of overall profitability.
|
INDEX FOR THE TARGET COMPANY |
Previous
|
Previous |
Last Year |
|
P & E Average Investment |
**** |
**** |
**** |
|
THE TARGET COMPANY REAL TERMS PROFILE |
|
|
P & E INVESTMENT |
% OF 10 YEAR AVERAGE |
|
P & E INVESTMENT: < than Depreciation |
**** |
|
P & E INVESTMENT: = to Depreciation |
**** |
|
P & E INVESTMENT: > than Depreciation |
**** |
|
P & E INVESTMENT: Unallocated |
**** |
|
PLANT & EQUIPMENT |
% OF TOTAL P & E |
|
PLANT & EQUIPMENT: Years Old: 0-3 |
**** |
|
PLANT & EQUIPMENT: Years Old: 3-6 |
**** |
|
PLANT & EQUIPMENT: Years Old: 6-9 |
**** |
|
PLANT & EQUIPMENT: Years Old: 9+ / Rest |
**** |
|
Company Plant & Equipment objectives
|
||||||||||||||||||||||||||||||||||||||||||||||
|
MARKET CONDITIONS: |
CONCLUSIONS FOR THE TARGET COMPANY: |
|||||||||||||||||||||||||||||||||||||||||||||
MARKET FINDING PLANT & EQUIPMENT COST: Forecast PROFIT & PROCESS COST REDUCTION : Forecast PROFIT & PROCESS COST REDUCTION : Share
|
FINANCIAL
CONCLUSION PLANT & EQUIPMENT COST: Financials PLANT & EQUIPMENT COST: Margins PROFIT & PROCESS COST REDUCTION : Financials PROFIT & PROCESS COST REDUCTION : Margins
|
|||||||||||||||||||||||||||||||||||||||||||||
 Market Definitions Market Definitions |
Financial Definitions |
|||||||||||||||||||||||||||||||||||||||||||||
NEW PRODUCTS / PRODUCT QUALITY & PROFITABILITY
|
NEW PRODUCTS / PRODUCT QUALITY & PROFITABILITY |
||||
|
THE TARGET COMPANY |
VALUE SCALE OF QUALITY |
|||
|
LOW |
AVERAGE |
HIGH |
||
|
NEW PRODUCTS AS A FUNCTION OF TOTAL SALES |
LOWER |
ROIc=****% |
ROIc=****% |
ROIc=****% |
|
SAME |
ROIc=****% |
ROIc=****% |
ROIc=****% |
|
|
HIGHER |
ROIc=****% |
ROIc=****% |
ROIc=****% |
|
A company experiencing a high level of
new product introduction will suffer in terms of overall
profitability if their product quality is low.
A company experiencing a high level of Product Quality may actually
benefit in profit terms in periods of limited new product introductions.
NEW PRODUCT EXPENDITURE EFFECT FORECASTS
The following pages analyses the
effects of New Product or Product Revision expenditure in terms of the Company's Financial and Operational results.
New
Products refer to entirely new products or services offered to
customers and Product Revisions refer to the improvement or
enhancement of existing products or services.
The data
assumes that the Company will increase its New Product investment by
a rate of 5% above that of the industry averages.
|
|
The following Excel spreadsheets (or the Access tables in the databases) should be used to produce a graphic representation of the relationship between the Company and the industry and market situation. The links below point to the industry and market situation, and to the situation in respect of the Company:- |
|
|
INDUSTRY & MARKET |
THE TARGET COMPANY |
|
|
|
||
|
|
||
There are
four major Competitive criteria which acutely affect the Company and
Products & Services Markets:-
1.
Market Share
2. Relative Market Share
3.
Nature of
the Competitive Environment
4.
Perfectness of the
Market
These factors are examined below and provide an extremely
important data set on which the Company may base strategic and tactical
decisions for the marketing of products and services.
|
Company Competitors |
Industry Competitors |
||
|
|
MARKET SHARE & PRODUCTS + SERVICES PROFITABILITY
|
MARKET SHARE & PRODUCTS + SERVICES PROFITABILITY |
|||||||||
|
CIRCUMSTANCES WHERE ROI IS GREATER THAN THE INDEX |
TOTAL NUMBER OF |
||||||||
|
. |
. |
. |
. |
. |
. |
. |
. |
. |
100% |
|
. |
. |
. |
. |
. |
. |
. |
. |
. |
90% |
|
. |
. |
. |
. |
. |
. |
. |
. |
. |
80% |
|
. |
. |
. |
. |
. |
. |
. |
. |
X |
75% |
|
. |
. |
. |
. |
. |
. |
. |
X |
. |
70% |
|
. |
. |
. |
. |
. |
. |
X |
. |
. |
65% |
|
. |
. |
. |
. |
. |
X |
. |
. |
. |
60% |
|
. |
. |
. |
. |
. |
X |
. |
. |
. |
55% |
|
. |
. |
. |
. |
X |
. |
. |
. |
. |
50% |
|
. |
. |
. |
X |
. |
. |
. |
. |
. |
45% |
|
. |
. |
X |
. |
. |
. |
. |
. |
. |
40% |
|
. |
. |
X |
. |
. |
. |
. |
. |
. |
35% |
|
. |
X |
. |
. |
. |
. |
. |
. |
. |
30% |
|
X |
. |
. |
. |
. |
. |
. |
. |
. |
25% |
|
. |
. |
. |
. |
. |
. |
. |
. |
. |
20% |
|
. |
. |
. |
. |
. |
. |
. |
. |
. |
15% |
|
. |
. |
. |
. |
. |
. |
. |
. |
. |
10% |
|
LOW |
--------- |
-------- |
-------- |
-------- |
-------- |
-------- |
-------- |
HIGH |
|
|
MARKET SHARE |
|||||||||
|
INDEX of YEAR-on-YEAR ROIc = % |
|
|
2008 |
****% |
|
2009 |
****% |
|
2010 |
****% |
|
2011 |
****% |
|
2012 |
****% |
|
2013 |
****% |
|
2014 |
****% |
|
2015 |
****% |
|
2016 |
****% |
|
2017 |
****% |
|
2018 |
****% |
|
2019 |
****% |
|
2020 |
****% |
|
... to 2028 |
****% |
It is self-evident that
the Company in having a higher Market Share are more likely to achieve a
higher profitability and this also holds true in the Products & Services
industry throughout the Trade Cell.
PRODUCTS + SERVICES PROFITABILITY & RELATIVE MARKET SHARE
|
PRODUCTS + SERVICES PROFITABILITY & RELATIVE MARKET SHARE |
|||||||||
|
**** |
**** |
**** |
**** |
**** |
**** |
**** |
**** |
**** |
ROIc=% |
|
. |
. |
. |
. |
. |
. |
. |
. |
. |
+200% |
|
. |
. |
. |
. |
. |
. |
. |
. |
. |
+180% |
|
. |
. |
. |
. |
. |
. |
. |
. |
. |
+160% |
|
. |
. |
. |
. |
. |
. |
. |
. |
. |
+140% |
|
. |
. |
. |
. |
. |
. |
. |
. |
. |
+120% |
|
. |
. |
. |
. |
. |
. |
. |
. |
. |
+100% |
|
. |
. |
. |
. |
. |
. |
. |
. |
. |
+80% |
|
. |
. |
. |
. |
. |
. |
. |
. |
. |
+60% |
|
. |
. |
. |
. |
. |
. |
. |
. |
. |
+40% |
|
. |
. |
. |
. |
. |
. |
. |
. |
. |
+20% |
|
. |
. |
. |
. |
. |
. |
. |
. |
. |
0% |
|
. |
. |
. |
. |
. |
. |
. |
. |
. |
-20% |
|
. |
. |
. |
. |
. |
. |
. |
. |
. |
-40% |
|
. |
. |
. |
. |
. |
. |
. |
. |
. |
-60% |
|
. |
. |
. |
. |
. |
. |
. |
. |
. |
-80% |
|
. |
. |
. |
. |
. |
. |
. |
. |
. |
-100% |
|
. |
. |
. |
. |
. |
. |
. |
. |
. |
-120% |
|
. |
. |
. |
. |
. |
. |
. |
. |
. |
-140% |
|
. |
. |
. |
. |
. |
. |
. |
. |
. |
-160% |
|
. |
. |
. |
. |
. |
. |
. |
. |
. |
-180% |
|
. |
. |
. |
. |
. |
. |
. |
. |
. |
-200% |
|
LOW -> -> -> -> -> - -> -> -> -> -> -> -> -> -> HIGH |
|||||||||
|
RELATIVE MARKET SHARE |
|||||||||
Products & Services Profitability is closely
correlated with Relative Market Share and thus in enjoying a high
Market Share, the Company will also experience a similarly high
profitability.
PRODUCTS + SERVICES MARKET SHARE STABILITY
The stability or instability of Trade
Cell Market Shares (at End User level) will potentially be an
opportunity or problem for the Company in terms of products and
services.
|
INDUSTRY TRADE CELL MARKET SHARE STABILITY
|
The above shows Trade Cell Market
Share stability (at End User level) which may potentially impact on
the Company in its provision of products and services.
|
INDEX FOR THE TARGET COMPANY |
Previous
|
Previous |
Last
Year |
|
Market Share Stability |
**** |
**** |
**** |
RELATIVE MARKET SHARES IN THE TRADE CELL
The Forecasted RELATIVE Market Shares (at End User level) CUMULATIVELY achieved by the FOUR largest suppliers of products and services are shown below.
|
INDUSTRY TRADE CELL CUMULATIVE MARKET SHARE
|
The above shows RELATIVE Trade Cell
Market Shares (at End User level) which may potentially be achieved by
the FOUR largest suppliers of products and services.
These
Relative Market Share percentages are based on the estimated cumulative
sales figures of the four major suppliers, divided by the Total Market
(as quantified in other sections) at this moment in time.
NATURE OF THE COMPETITIVE SITUATION FOR
PRODUCTS + SERVICES
ENTRY & EXIT OF
INDUSTRY COMPETITORS IN PRODUCTS + SERVICES MARKETS
|
TRADE CELL COMPETITOR ENTRY + EXIT
|
The above shows an index of relative
Entry or Exit of Competitors over time. The term 'Competitors' denotes
suppliers as well as subsidiaries and other marketing or distribution
companies providing products and services.
The index norm is shown
as '100' and this represents an equilibrium situation where the numbers of
Competitor Entries equal the numbers of Competitor Exits. An index greater
than 100 indicates more competitor entries than exits, and vice versa.
|
THE TARGET COMPANY COMPETITORS: |
INDEX |
|
Company Competitors 1 |
**** |
|
Company Competitors 2 |
**** |
|
Company Competitors 3 |
**** |
|
Company Competitors 4 |
**** |
|
Company Competitors 5 |
**** |
|
Company Competitors 6 |
**** |
|
Company Competitors 7 |
**** |
|
Company Competitors 8 |
**** |
|
Company Competitors 9 |
**** |
|
Company Competitors 10 |
**** |
|
Company Competitors 11 |
**** |
|
Company Competitors 12 |
**** |
|
Company Competitors 13 |
**** |
|
Company Competitors 14 |
**** |
|
Company Competitors 15 |
**** |
RELATIVE STRENGTHS OF COMPETITORS IN PRODUCTS + SERVICES MARKETS
|
TRADE CELL RELATIVE INDUSTRY COMPETITOR STRENGTHS
|
The above shows an index of relative
Strengths of Competitors over time. The term 'Competitors' denotes
suppliers as well as subsidiaries and other marketing or distribution
companies providing products and services.
PERFECTNESS OF THE PRODUCTS + SERVICES MARKET
RELATIVE PERFECTNESS OF
THE PRODUCTS + SERVICES MARKETS
|
INDUSTRY TRADE CELL RELATIVE MARKET PERFECTNESS
|
The above shows an index of relative
Perfectness of the Markets over time. The index norm is shown as '100' and
this represents an equilibrium situation where the Market for Products &
Services
is neither PERFECT nor IMPERFECT. An index above '100' shows more Perfectness and an index below '100' shows that the market is relatively
Imperfect.
Evidence of the Perfectness or Imperfectness of the
Products & Services markets is indicated as being greater than or less than the
norm. The measure of Perfectness is the classical economic definition of the
term and relates to the existence of a very competitive 'open-market'
situation in which prices are determined by supply and demand, there are no
barriers to entry and trading is not restricted in any way, thus enabling
the full exploitation and benefit from the freeness of the marketplace. The
more Perfect the market the less the evidence of restrictive practices,
trade cartels and agreements and overall legislation.
Among
the critical Industry factors which will affect the Company are the
following:-
1.
Long Term Industry
Growth
2. Physical Process
Considerations
3.
Capital Structure in terms of Investment & Capital Intensity
4.
Physical Process in terms of Vertical Integration
5.
Marketing / Sales
Costs
6.
Product Development and Process Development Costs
Before examining the above factors and their relationship to
Products & Services profitability it is proposed that a few paragraphs be
devoted to more general aspects of the Products & Services industry and the
questions these aspects may raise for the Company.
The business and industrial environment in the Trade Cell is
predominantly one of powerful industrial groups struggling to survive in
an increasingly harsh economic climate. These large and cohesive
operating units usually supply and market through established channels
and are thus to some extent screened from the full impact of the
competitive forces in the marketplace. The major problem of competition
will inevitably hark back to Process Costs and Operating Costs and the
first question which the Company must ask is if they are able to compete
using their present means of operation.
The Company must consider a number of issues pertinent to the supply and
marketing of products and services:-
|
a. |
Process
Costs and Profitability |
|
b. |
Market
Dominance Can the Company effectively compete in the Products & Services market against competitors who are perhaps wielding the prerogatives of Market Dominance? |
Large market share competitors will earn higher profits and/or because of
their corporate strengths will be able to control and administer both their
own process costs and market prices. Such competitors are likely to adopt an
aggressive marketing stance if competition is seen to be a serious threat
and may embark on a price war; can the Company cope with a price war?
|
THE TARGET COMPANY INDUSTRY INDICES |
Previous |
Previous |
Last Year |
|
P & E Av Investment |
**** |
**** |
**** |
|
Relative Prices |
**** |
**** |
**** |
|
New Products |
**** |
**** |
**** |
|
Relative Quality |
**** |
**** |
**** |
|
Salesforce Expenditure |
**** |
**** |
**** |
|
Advertising Expenditure |
**** |
**** |
**** |
|
Promotional Expenditure |
**** |
**** |
**** |
|
Product Adoption |
**** |
**** |
**** |
|
Sales Conversion |
**** |
**** |
**** |
|
Sales Growth |
**** |
**** |
**** |
|
Capacity Utilization |
**** |
**** |
**** |
|
Product Standardization |
**** |
**** |
**** |
|
Relative Compensation |
**** |
**** |
**** |
|
Market Share Stability |
**** |
**** |
**** |
|
Relative Integration |
**** |
**** |
**** |
LONG TERM INDUSTRY GROWTH
The following table gives the forecasted long term annual growth rate in REAL TERMS for the Products & Services industry:-
|
TRADE CELL INDUSTRY GROWTH INDEX
|
The above shows an index of Industry Growth over time.
The
index norm is shown as '100' and this represents ZERO growth for the
Products & Services industry.
These annual growth rate figures represent
real terms growth and are plotted as a year-on-year median probability trend
line.
PHYSICAL PROCESS CONSIDERATIONS
PHYSICAL PROCESS CAPACITY UTILIZATION & MARKET SHARE
|
PHYSICAL PROCESS CAPACITY UTILIZATION & MARKET SHARE |
||||
|
THE TARGET COMPANY |
PROCESS COSTS / SALES |
|||
|
LOWER |
SAME |
HIGHER |
||
|
RELATIVE MARKET SHARE |
LOW |
ROIc=****% |
ROIc=****% |
ROIc=****% |
|
MEDIUM |
ROIc=****% |
ROIc=****% |
ROIc=****% |
|
|
HIGH |
ROIc=****% |
ROIc=****% |
ROIc=****% |
|
Process Intensity is highly critical to profitability irrespective of
the relative market shares held by the Company.
CAPACITY UTILIZATION & MARKET SHARE
|
CAPACITY UTILIZATION & MARKET SHARE |
||||
|
THE TARGET COMPANY |
CAPACITY UTILIZATION |
|||
|
LOWER |
SAME |
HIGHER |
||
|
RELATIVE MARKET SHARE |
LOW |
ROIc=****% |
ROIc=****% |
ROIc=****% |
|
MEDIUM |
ROIc=****% |
ROIc=****% |
ROIc=****% |
|
|
HIGH |
ROIc=****% |
ROIc=****% |
ROIc=****% |
|
With a low level of market penetration, capacity utilization is
extremely critical.
|
INDEX FOR THE TARGET COMPANY |
Previous
|
Previous |
Last
Year |
|
Capacity Utilization |
**** |
**** |
**** |
If the Company experiences a low market share of the
Products & Services
market, together with a low capacity utilization, then it will tend to
achieve a much lower profitability than if the Company experiences a
high market share. If the Company experiences a high market share it
will be far more able to overcome the problems associated with reduced
capacity utilization and are therefore able to retain overall
profitability.
PRODUCTIVITY / PRODUCTS + SERVICES PROFITABILITY / MARKET GROWTH
|
PRODUCTIVITY / PRODUCTS + SERVICES PROFITABILITY / MARKET GROWTH |
||||
|
THE TARGET COMPANY |
SALES PER EMPLOYEE |
|||
|
LOWER |
SAME |
HIGHER |
||
|
LONG-TERM MARKET GROWTH RATE |
LOW |
ROIc=****% |
ROIc=****% |
ROIc=****% |
|
MEDIUM |
ROIc=****% |
ROIc=****% |
ROIc=****% |
|
|
HIGH |
ROIc=****% |
ROIc=****% |
ROIc=****% |
|
Operating in high growth markets requires a high level of employee
productivity in order to maintain profitability.
|
INDUSTRY EMPLOYEE RANGES |
% OF TOTAL |
|
EMPLOYEE RANGES: 1-19 Employees |
**** |
|
EMPLOYEE RANGES: 20-99 Employees |
**** |
|
EMPLOYEE RANGES: 100+ Employees |
**** |
|
EMPLOYEE RANGES: Unallocated |
**** |
|
UNIONIZATION & MARKET SHARE |
||||
|
THE TARGET COMPANY |
EMPLOYEE UNIONIZATION |
|||
|
LOWER |
SAME |
HIGHER |
||
|
RELATIVE MARKET SHARE |
LOW |
ROIc=****% |
ROIc=****% |
ROIc=****% |
|
MEDIUM |
ROIc=****% |
ROIc=****% |
ROIc=****% |
|
|
HIGH |
ROIc=****% |
ROIc=****% |
ROIc=****% |
|
When the Company experiences a high level
of unionized labor and a high market share it will tend to experience a
lower level of profitability when compared with a similar market share but a
lower level of employee unionization. These effects are more pronounced
where the unionization imposes additional costs, for example pensions or
health care entitlements where the workforce is aging.
At lower
market share levels unionization does not adversely affect profitability and
in many instances will actually assist profitability to a certain extent.
UNIONIZATION / PRODUCTS + SERVICES PROFITABILITY & MARKET GROWTH
|
UNIONIZATION / PRODUCTS + SERVICES PROFITABILITY & MARKET GROWTH |
||||
|
THE TARGET COMPANY |
EMPLOYEE UNIONIZATION |
|||
|
LOWER |
SAME |
HIGHER |
||
|
LONG-TERM MARKET GROWTH* |
LOW |
ROIc=****% |
ROIc=****% |
ROIc=****% |
|
MEDIUM |
ROIc=****% |
ROIc=****% |
ROIc=****% |
|
|
HIGH |
ROIc=****% |
ROIc=****% |
ROIc=****% |
|
In low growth markets the affects of high
unionization is most profound. A high level of labor unionization in low
growth markets or periods of low growth will adversely effect profitability.
High employee unionization will not drastically impair profitability in high
growth markets or in periods of high growth. * Market Growth in Real Terms.
UNIONIZATION / PRODUCTS + SERVICES PROFITABILITY & INDUSTRY CONCENTRATION
|
UNIONIZATION / PRODUCTS + SERVICES PROFITABILITY & INDUSTRY CONCENTRATION |
||||
|
THE TARGET COMPANY |
EMPLOYEE UNIONIZATION |
|||
|
LOWER |
SAME |
HIGHER |
||
|
INDUSTRY CONCENTRATION |
LOW |
ROIc=****% |
ROIc=****% |
ROIc=****% |
|
MEDIUM |
ROIc=****% |
ROIc=****% |
ROIc=****% |
|
|
HIGH |
ROIc=****% |
ROIc=****% |
ROIc=****% |
|
In situations with a highly concentrated industry high unionization
will adversely effect profitability.
|
INDUSTRY SUPPLIER CONCENTRATION |
% OF TOTAL AVAILABLE REVENUE* |
|
SUPPLIER CONCENTRATION: Largest 8 companies |
**** |
|
SUPPLIER CONCENTRATION: Largest 8 companies |
**** |
|
SUPPLIER CONCENTRATION: Largest 50 companies |
**** |
|
SUPPLIER CONCENTRATION: Unallocated |
**** |
UNIONIZATION / PRODUCTS + SERVICES PROFITABILITY & HARVESTING STRATEGIES
|
UNIONIZATION / PRODUCTS + SERVICES PROFITABILITY & HARVESTING STRATEGIES |
||||
|
THE TARGET COMPANY |
EMPLOYEE UNIONIZATION |
|||
|
LOWER |
SAME |
HIGHER |
||
|
MARKET SHARE STRATEGY |
HARVEST |
ROIc=****% |
ROIc=****% |
ROIc=****% |
|
HOLD |
ROIc=****% |
ROIc=****% |
ROIc=****% |
|
|
BUILD |
ROIc=****% |
ROIc=****% |
ROIc=****% |
|
If the Company experiences a high level of Employee Unionization they are
also likely to experience relatively low profitability if they attempt to
Harvest their market share.
PRODUCTS + SERVICES PROFITABILITY / PROCESS UNIQUENESS & MARKET SHARE
|
PRODUCTS + SERVICES PROFITABILITY / PROCESS UNIQUENESS & MARKET SHARE |
||||
|
THE TARGET COMPANY |
PROCESS UNIQUENESS |
|||
|
LESS UNIQUE |
SAME |
MORE UNIQUE |
||
|
RELATIVE MARKET SHARE |
LOW |
ROIc=****% |
ROIc=****% |
ROIc=****% |
|
MEDIUM |
ROIc=****% |
ROIc=****% |
ROIc=****% |
|
|
HIGH |
ROIc=****% |
ROIc=****% |
ROIc=****% |
|
Where the Company has a high market share it will not benefit from physical
process uniqueness. Small and Medium market shares will reap the greatest
profitability benefits from process uniqueness.
|
The Company Systems Investment objectives
|
|||||||||||
|
ANALYSIS MARKET CONDITIONS: |
CONCLUSIONS FOR THE TARGET COMPANY: |
||||||||||
| MARKET FINDING |
FINANCIAL CONCLUSION |
||||||||||
|
Market Definitions |
Financial Definitions |
||||||||||
CAPITAL STRUCTURE IN TERMS OF INVESTMENT INTENSITY
In the main, Investment Intensity does not
assist profitability in the Products & Services industry.
As Investment
Intensity increases this enlarges the denominator of Return on Investment
and consequently profitability suffers.
Investment Intensity may
also encourage and fuel the intensity of competition as the high levels of
investment and fixed costs make plant loadings and capacity utilization
highly critical and thereby is likely to provoke discounting, price wars and
similar short term expediencies designed to improve sales.
Investment Intensity is a particular danger during periods of:-
a) access to plentiful and cheap capital or
financing by parent groups
b) scarcity of
suitable labor
c) wage demands or
cost pressures from
labor costs
d) management predilections towards automation or
sophisticated processes
e) financial or fiscal advantages of
capital equipment debt.
PRODUCTS + SERVICES PROFITABILITY & INVESTMENT INTENSITY
|
PRODUCTS + SERVICES PROFITABILITY & INVESTMENT INTENSITY |
|||||||||
|
**** |
**** |
**** |
**** |
**** |
**** |
**** |
**** |
**** |
ROIc=% |
|
. |
. |
. |
. |
. |
. |
. |
. |
. |
+200% |
|
. |
. |
. |
. |
. |
. |
. |
. |
. |
+180% |
|
. |
. |
. |
. |
. |
. |
. |
. |
. |
+160% |
|
. |
. |
. |
. |
. |
. |
. |
. |
. |
+140% |
|
. |
. |
. |
. |
. |
. |
. |
. |
. |
+120% |
|
. |
. |
. |
. |
. |
. |
. |
. |
. |
+100% |
|
. |
. |
. |
. |
. |
. |
. |
. |
. |
+80% |
|
. |
. |
. |
. |
. |
. |
. |
. |
. |
+60% |
|
. |
. |
. |
. |
. |
. |
. |
. |
. |
+40% |
|
. |
. |
. |
. |
. |
. |
. |
. |
. |
+20% |
|
. |
. |
. |
. |
. |
. |
. |
. |
. |
0% |
|
. |
. |
. |
. |
. |
. |
. |
. |
. |
-20% |
|
. |
. |
. |
. |
. |
. |
. |
. |
. |
-40% |
|
. |
. |
. |
. |
. |
. |
. |
. |
. |
-60% |
|
. |
. |
. |
. |
. |
. |
. |
. |
. |
-80% |
|
. |
. |
. |
. |
. |
. |
. |
. |
. |
-100% |
|
. |
. |
. |
. |
. |
. |
. |
. |
. |
-120% |
|
. |
. |
. |
. |
. |
. |
. |
. |
. |
-140% |
|
. |
. |
. |
. |
. |
. |
. |
. |
. |
-160% |
|
. |
. |
. |
. |
. |
. |
. |
. |
. |
-180% |
|
. |
. |
. |
. |
. |
. |
. |
. |
. |
-200% |
|
LOW -> -> -> -> -> -> -> -> -> -> -> -> -> -> -> -> -> -> HIGH |
|||||||||
|
INVESTMENT / SALES |
|||||||||
Profitability usually tends to decline consistently in the Products & Services industry as the level of Investment Intensity increases.
NEW PLANT + EQUIPMENT INVESTMENT EFFECT FORECASTS
This section analyses the effects of a New Plant and Equipment
Investment programme and its inherent expenditure in terms of the Company's Financial and Operational results.
By the very
nature of New Plant + Equipment programmes the lead-times are extensive
and the pay-back period tends to be rather protracted. The benefits from
this scenario will not be seen for some 3-5 years from inception.
|
|
The following Excel spreadsheets (or the Access tables in the databases) should be used to produce a graphic representation of the relationship between the Company and the industry and market situation. The links below point to the industry and market situation, and to the situation in respect of the Company:- |
|
|
INDUSTRY & MARKET |
THE TARGET COMPANY |
|
|
|
||
|
|
||
NET MARGINS & INVESTMENT INTENSITY
|
NET MARGINS & INVESTMENT INTENSITY |
|||||||||
|
**** |
**** |
**** |
**** |
**** |
**** |
**** |
**** |
**** |
ROSc=% |
|
. |
. |
. |
. |
. |
. |
. |
. |
. |
+200% |
|
. |
. |
. |
. |
. |
. |
. |
. |
. |
+180% |
|
. |
. |
. |
. |
. |
. |
. |
. |
. |
+160% |
|
. |
. |
. |
. |
. |
. |
. |
. |
. |
+140% |
|
. |
. |
. |
. |
. |
. |
. |
. |
. |
+120% |
|
. |
. |
. |
. |
. |
. |
. |
. |
. |
+100% |
|
. |
. |
. |
. |
. |
. |
. |
. |
. |
+80% |
|
. |
. |
. |
. |
. |
. |
. |
. |
. |
+60% |
|
. |
. |
. |
. |
. |
. |
. |
. |
. |
+40% |
|
. |
. |
. |
. |
. |
. |
. |
. |
. |
+20% |
|
. |
. |
. |
. |
. |
. |
. |
. |
. |
0% |
|
. |
. |
. |
. |
. |
. |
. |
. |
. |
-20% |
|
. |
. |
. |
. |
. |
. |
. |
. |
. |
-40% |
|
. |
. |
. |
. |
. |
. |
. |
. |
. |
-60% |
|
. |
. |
. |
. |
. |
. |
. |
. |
. |
-80% |
|
. |
. |
. |
. |
. |
. |
. |
. |
. |
-100% |
|
. |
. |
. |
. |
. |
. |
. |
. |
. |
-120% |
|
. |
. |
. |
. |
. |
. |
. |
. |
. |
-140% |
|
. |
. |
. |
. |
. |
. |
. |
. |
. |
-160% |
|
. |
. |
. |
. |
. |
. |
. |
. |
. |
-180% |
|
. |
. |
. |
. |
. |
. |
. |
. |
. |
-200% |
|
LOW -> -> -> -> -> -> -> -> - -> -> -> -> -> -> -> -> HIGH |
|||||||||
|
INVESTMENT / SALES |
|||||||||
Net Margins (in terms of Return on Sales)
usually tends to decline consistently in the Products & Services industry as the
level of Investment Intensity increases.
MARGINS & INVESTMENT INTENSITY
|
MARGINS & INVESTMENT INTENSITY |
|||||||||
|
**** |
**** |
**** |
**** |
**** |
**** |
**** |
**** |
**** |
ROSc=% |
|
. |
. |
. |
. |
. |
. |
. |
. |
. |
+200% |
|
. |
. |
. |
. |
. |
. |
. |
. |
. |
+180% |
|
. |
. |
. |
. |
. |
. |
. |
. |
. |
+160% |
|
. |
. |
. |
. |
. |
. |
. |
. |
. |
+140% |
|
. |
. |
. |
. |
. |
. |
. |
. |
. |
+120% |
|
. |
. |
. |
. |
. |
. |
. |
. |
. |
+100% |
|
. |
. |
. |
. |
. |
. |
. |
. |
. |
+80% |
|
. |
. |
. |
. |
. |
. |
. |
. |
. |
+60% |
|
. |
. |
. |
. |
. |
. |
. |
. |
. |
+40% |
|
. |
. |
. |
. |
. |
. |
. |
. |
. |
+20% |
|
. |
. |
. |
. |
. |
. |
. |
. |
. |
0% |
|
. |
. |
. |
. |
. |
. |
. |
. |
. |
-20% |
|
. |
. |
. |
. |
. |
. |
. |
. |
. |
-40% |
|
. |
. |
. |
. |
. |
. |
. |
. |
. |
-60% |
|
. |
. |
. |
. |
. |
. |
. |
. |
. |
-80% |
|
. |
. |
. |
. |
. |
. |
. |
. |
. |
-100% |
|
. |
. |
. |
. |
. |
. |
. |
. |
. |
-120% |
|
. |
. |
. |
. |
. |
. |
. |
. |
. |
-140% |
|
. |
. |
. |
. |
. |
. |
. |
. |
. |
-160% |
|
. |
. |
. |
. |
. |
. |
. |
. |
. |
-180% |
|
. |
. |
. |
. |
. |
. |
. |
. |
. |
-200% |
|
LOW -> -> -> -> -> -> -> -> -> -> -> ->-> -> -> -> -> -> -> -> -> HIGH |
|||||||||
|
INVESTMENT / SALES |
|||||||||
Gross Margins (in terms of Return on
Sales) will usually decline only slightly in the Products & Services industry as
the level of Investment Intensity increases.
PRODUCTS + SERVICES PROFITABILITY / MARKET SHARE & CAPITAL INTENSITY
|
PRODUCTS + SERVICES PROFITABILITY / MARKET SHARE & CAPITAL INTENSITY |
||||
|
THE TARGET COMPANY |
RELATIVE MARKET SHARE |
|||
|
LOW |
AVERAGE |
HIGH |
||
|
FIXED CAPITAL INTENSITY* |
LOWER |
ROIc=****% |
ROIc=****% |
ROIc=****% |
|
SAME |
ROIc=****% |
ROIc=****% |
ROIc=****% |
|
|
HIGHER |
ROIc=****% |
ROIc=****% |
ROIc=****% |
|
When the Company experiences a high level
of Fixed Capital Investment, and a low market share, it will tend to
experience a significantly lower level of profitability when compared if it
experiences both low Fixed Capital Investment and a high market share.
* Fixed Capital Intensity is defined as the Book Value of Plant & Equipment
as a percentage of Sales.
PRODUCTIVITY / PRODUCTS + SERVICES PROFITABILITY & INVESTMENT INTENSITY
|
PRODUCTIVITY / PRODUCTS + SERVICES PROFITABILITY & INVESTMENT INTENSITY |
||||
|
THE TARGET COMPANY |
SALES PER EMPLOYEE |
|||
|
LOWER |
SAME |
HIGHER |
||
|
INVESTMENTS divided by ADDED VALUE |
LOW |
ROIc=****% |
ROIc=****% |
ROIc=****% |
|
MEDIUM |
ROIc=****% |
ROIc=****% |
ROIc=****% |
|
|
HIGH |
ROIc=****% |
ROIc=****% |
ROIc=****% |
|
In Investment Intensive situations high
productivity is essential to profitability. A low level of productivity will
drastically reduce profitability, especially where Investment Intensity is
high.
PROCESS CAPACITY UTILIZATION / PRODUCTS + SERVICES PROFITABILITY & CAPITAL INTENSITY
|
PROCESS CAPACITY UTILIZATION / PRODUCTS + SERVICES PROFITABILITY & CAPITAL INTENSITY |
||||
|
THE TARGET COMPANY |
PROCESS CAPACITY UTILIZATION |
|||
|
LOWER |
SAME |
HIGHER |
||
|
FIXED CAPITAL INTENSITY* |
LOW |
ROIc=****% |
ROIc=****% |
ROIc=****% |
|
MEDIUM |
ROIc=****% |
ROIc=****% |
ROIc=****% |
|
|
HIGH |
ROIc=****% |
ROIc=****% |
ROIc=****% |
|
Process Capacity Utilization will have a
nominal effect on profitability in the Company when it experiences a low
level of Fixed Capital Intensity, however this adverse effect is
significantly amplified as Fixed Capital Intensity rises.
* Fixed
Capital Intensity is defined as the Book Value of Plant & Equipment as a
percentage of Sales.
INVENTORIES / PRODUCTS + SERVICES PROFITABILITY & CAPITAL INTENSITY
|
INVENTORIES / PRODUCTS + SERVICES PROFITABILITY & CAPITAL INTENSITY |
||||
|
THE TARGET COMPANY |
INVENTORY / SALES |
|||
|
LOWER |
SAME |
HIGHER |
||
|
FIXED CAPITAL INTENSITY* |
LOW |
ROIc=****% |
ROIc=****% |
ROIc=****% |
|
MEDIUM |
ROIc=****% |
ROIc=****% |
ROIc=****% |
|
|
HIGH |
ROIc=****% |
ROIc=****% |
ROIc=****% |
|
A High Inventory holding is very critical
to profitability irrespective of the level Fixed Capital Intensity. The
higher the level of Fixed Capital Intensity the greater the negative effect
of a high Inventory holding.
* Fixed Capital Intensity is defined as
the Book Value of Plant & Equipment as a percentage of Sales.
PHYSICAL PROCESS IN TERMS OF VERTICAL INTEGRATION
In the context of this section Vertical Integration is measured in terms
of Added Value divided by Sales.
PRODUCTS + SERVICES PROFITABILITY / MARKET SHARE & VERTICAL INTEGRATION
|
PRODUCTS + SERVICES PROFITABILITY / MARKET SHARE & VERTICAL INTEGRATION |
||||
|
THE TARGET COMPANY |
RELATIVE MARKET SHARE |
|||
|
LOW |
AVERAGE |
HIGH |
||
|
VALUE ADDED divided by SALES |
LOWER |
ROIc=****% |
ROIc=****% |
ROIc=****% |
|
SAME |
ROIc=****% |
ROIc=****% |
ROIc=****% |
|
|
HIGHER |
ROIc=****% |
ROIc=****% |
ROIc=****% |
|
The acquisition of a high market share
will be most important to situations which have a substantial degree of
Vertical Integration.
Vertical Integration is however relatively
unimportant to the Company experiencing a low market share.
PRODUCT + SERVICES PROFITABILITY / DIVERSIFICATION / VERTICAL INTEGRATION
|
PRODUCTS + SERVICES PROFITABILITY / DIVERSIFICATION & VERTICAL INTEGRATION |
||||
|
THE TARGET COMPANY |
OVERALL DIVERSIFICATION |
|||
|
MORE DIVERSIFIED |
AVERAGE |
LESS DIVERSIFIED |
||
|
VALUE ADDED divided by SALES |
LOWER |
ROIc=****% |
ROIc=****% |
ROIc=****% |
|
SAME |
ROIc=****% |
ROIc=****% |
ROIc=****% |
|
|
HIGHER |
ROIc=****% |
ROIc=****% |
ROIc=****% |
|
If the Company experiences a high degree
of Corporate Diversification it will enjoy a higher profitability if they
are also Vertically Integrated.
Conversely, Corporate
Diversification has a negative effect on profitability in situations which
do not have a substantial Vertical Integration.
PRODUCTS + SERVICES PROFITABILITY / VERTICAL INTEGRATION & CUSTOMER BASE
|
PRODUCTS + SERVICES PROFITABILITY / VERTICAL INTEGRATION & CUSTOMER BASE |
||||
|
THE TARGET COMPANY |
PHYSICAL CUSTOMER BASE |
|||
|
SMALL |
AVERAGE |
LARGE |
||
|
VALUE ADDED divided by SALES |
LOWER |
ROIc=****% |
ROIc=****% |
ROIc=****% |
|
SAME |
ROIc=****% |
ROIc=****% |
ROIc=****% |
|
|
HIGHER |
ROIc=****% |
ROIc=****% |
ROIc=****% |
|
A low level of Vertical Integration is
critical in profit terms to situations which have to service a numerically
large number of customers.
The numbers of customers serviced is
however relatively unimportant to the Company when it experiences a high
level of Vertical Integration.
|
INDUSTRY IMMEDIATE CUSTOMER BASE |
% OF TOTAL REVENUE |
|
IMMEDIATE CUSTOMER BASE: Wholesale & Retail |
**** |
|
IMMEDIATE CUSTOMER BASE: Manufacturers & OEM |
**** |
|
IMMEDIATE CUSTOMER BASE: End Users |
**** |
|
IMMEDIATE CUSTOMER BASE: Unallocated |
**** |
PRODUCTS + SERVICES PROFITABILITY / VERTICAL INTEGRATION & PRODUCT QUALITY
|
PRODUCTS + SERVICES PROFITABILITY / VERTICAL INTEGRATION & PRODUCT QUALITY |
||||
|
THE TARGET COMPANY |
PRODUCT QUALITY |
|||
|
LOWER |
SAME |
HIGHER |
||
|
VALUE ADDED divided by SALES |
LOW |
ROIc=****% |
ROIc=****% |
ROIc=****% |
|
MEDIUM |
ROIc=****% |
ROIc=****% |
ROIc=****% |
|
|
HIGH |
ROIc=****% |
ROIc=****% |
ROIc=****% |
|
A low level of Vertical Integration is especially critical to
profitability in situations which have a low Product Quality.
Quality is also important to
the Company when it experiences a high degree
of Vertical Integration.
PRODUCTS + SERVICES PROFITABILITY / VERTICAL INTEGRATION & INVENTORIES
|
PRODUCTS + SERVICES PROFITABILITY / VERTICAL INTEGRATION & INVENTORIES |
||||
|
THE TARGET COMPANY |
INVENTORY RATIOS |
|||
|
LOWER |
SAME |
HIGHER |
||
|
VALUE ADDED divided by SALES |
LOW |
ROIc=****% |
ROIc=****% |
ROIc=****% |
|
MEDIUM |
ROIc=****% |
ROIc=****% |
ROIc=****% |
|
|
HIGH |
ROIc=****% |
ROIc=****% |
ROIc=****% |
|
A low level of Vertical Integration is especially critical to
profitability in situations which have a high Inventory value.
A
large Inventory is also important to the Company if it experiences a high
degree of Vertical Integration.
PRODUCTS + SERVICES PROFITABILITY / VERTICAL INTEGRATION & PRODUCTIVITY
|
PRODUCTS + SERVICES PROFITABILITY / VERTICAL INTEGRATION & PRODUCTIVITY |
||||
|
THE TARGET COMPANY |
VALUE ADDED / EMPLOYEE RATIOS |
|||
|
LOWER |
SAME |
HIGHER |
||
|
VALUE ADDED divided by SALES |
LOW |
ROIc=****% |
ROIc=****% |
ROIc=****% |
|
MEDIUM |
ROIc=****% |
ROIc=****% |
ROIc=****% |
|
|
HIGH |
ROIc=****% |
ROIc=****% |
ROIc=****% |
|
A low level of Vertical Integration is especially critical to
profitability in situations which have a low Employee Productivity.
Employee Productivity is relatively unimportant to
the Company if it
experiences a high degree of Vertical Integration.
NEW TECHNOLOGY INVESTMENT EFFECT FORECASTS
This paragraph analyses the effects of a New Technology Investment
programme and its inferred overhead in terms of the Company's Financial
and Operational results.
New Technology Investment programmes
are long-range investments which do not necessarily bear fruit until
after year 5 or after. The implementation of such investment is
essential for the long-term survival of the Company and failure in this
respect reflects on the survivability of the Company.
|
|
The following Excel spreadsheets (or the Access tables in the databases) should be used to produce a graphic representation of the relationship between the Company and the industry and market situation. The links below point to the industry and market situation, and to the situation in respect of the Company:- |
|
|
INDUSTRY & MARKET |
THE TARGET COMPANY |
|
|
|
|
|
|
|
NEW TECHNOLOGY INV: Financials
|
NEW TECHNOLOGY INV: Financials
|
PRODUCTS + SERVICES PROFITABILITY / MARKET SHARE & MARKETING COSTS
|
PRODUCTS + SERVICES PROFITABILITY / MARKET SHARE & MARKETING COSTS |
||||
|
THE TARGET COMPANY |
MARKETING COSTS / SALES RATIOS |
|||
|
LOWER |
SAME |
HIGHER |
||
|
RELATIVE MARKET SHARE |
LOW |
ROIc=****% |
ROIc=****% |
ROIc=****% |
|
MEDIUM |
ROIc=****% |
ROIc=****% |
ROIc=****% |
|
|
HIGH |
ROIc=****% |
ROIc=****% |
ROIc=****% |
|
A low Market Share is especially critical to profitability in
situations which have a high level of Marketing Costs.
Marketing
Costs are relatively unimportant to the Company when it experiences a high
Market Share.
PRODUCTS + SERVICES PROFITABILITY / INVESTMENT INTENSITY & MARKETING COSTS
|
PRODUCTS + SERVICES PROFITABILITY / INVESTMENT INTENSITY & MARKETING COSTS |
||||
|
THE TARGET COMPANY |
MARKETING COSTS / SALES RATIOS |
|||
|
LOWER |
SAME |
HIGHER |
||
|
INVESTMENTS divided by ADDED VALUE |
LOW |
ROIc=****% |
ROIc=****% |
ROIc=****% |
|
MEDIUM |
ROIc=****% |
ROIc=****% |
ROIc=****% |
|
|
HIGH |
ROIc=****% |
ROIc=****% |
ROIc=****% |
|
Investment Intensity is especially critical to profitability in
situations which have a high level of Marketing Costs.
Increased
Marketing Costs will adversely affect profitability at all levels of
Investment Intensity.
PRODUCTS + SERVICES PROFITABILITY / CUSTOMER BASE & MARKETING COSTS
|
PRODUCTS + SERVICES PROFITABILITY / CUSTOMER BASE & MARKETING COSTS |
||||
|
THE TARGET COMPANY |
MARKETING COSTS / SALES RATIOS |
|||
|
LOWER |
SAME |
HIGHER |
||
|
PHYSICAL CUSTOMER BASE |
SMALL |
ROIc=****% |
ROIc=****% |
ROIc=****% |
|
SAME |
ROIc=****% |
ROIc=****% |
ROIc=****% |
|
|
LARGER |
ROIc=****% |
ROIc=****% |
ROIc=****% |
|
A numerically small number of Customers
is especially critical to profitability in situations which have a high
level of Marketing Costs.
A high level of Marketing Costs will
positively benefit profitability in the Company where it has a high numeric
number of Customers.
|
|
The following Excel spreadsheets (or the Access tables in the databases) should be used to produce a graphic representation of the relationship between the Company and the industry and market situation. The links below point to the industry and market situation, and to the situation in respect of the Company:- |
|
|
INDUSTRY & MARKET |
THE TARGET COMPANY |
|
Fixed Marketing Costs |
||
|
|
||
|
|
||
Variable Marketing Costs |
||
|
|
||
|
|
||
General Marketing Process Costs |
||
|
|
||
|
|
||
PRODUCTS + SERVICES PROFITABILITY / PRODUCT QUALITY & MARKETING COSTS
|
PRODUCTS + SERVICES PROFITABILITY / PRODUCT QUALITY & MARKETING COSTS |
||||
|
THE TARGET COMPANY |
MARKETING COSTS / SALES RATIOS |
|||
|
LOWER |
SAME |
HIGHER |
||
|
PRODUCT QUALITY |
LOW |
ROIc=****% |
ROIc=****% |
ROIc=****% |
|
NORMAL |
ROIc=****% |
ROIc=****% |
ROIc=****% |
|
|
HIGH |
ROIc=****% |
ROIc=****% |
ROIc=****% |
|
A low Product Quality is especially
critical to profitability in situations which have a high level of Marketing
Costs.
When the Company has high Product Quality it is less affected by high
Marketing Costs and its profitability is damaged less.
PRODUCTS + SERVICES PROFITABILITY / NEW PRODUCTS & MARKETING COSTS
|
PRODUCTS + SERVICES PROFITABILITY / NEW PRODUCTS & MARKETING COSTS |
||||
|
THE TARGET COMPANY |
MARKETING COSTS / SALES RATIOS |
|||
|
LOWER |
SAME |
HIGHER |
||
|
NEW PRODUCT INTRODUCTIONS |
LOW |
ROIc=****% |
ROIc=****% |
ROIc=****% |
|
NORMAL |
ROIc=****% |
ROIc=****% |
ROIc=****% |
|
|
HIGH |
ROIc=****% |
ROIc=****% |
ROIc=****% |
|
A high rate of New Product Introduction
is especially critical to profitability in situations that have a high level
of Marketing Costs.
When the Company experiences a low level of New Product Introductions they
are less effected by high Marketing Costs, and in many cases can actually
increase profitability through a higher rate of Marketing Expenditure.
MARKETING EXPENDITURE CHANGE FORECASTS
This section analyses the effects of a changes in Advertising and
Marketing expenditure in terms of the Company's Financial and
Operational results.
Marketing Expenditure includes Sales &
Selling costs, Distribution / Warehousing / Handling / Processing costs,
Advertising / Promotional costs, After-sales costs and Total Marketing
costs.
The Scenario assumes that the Company increases its
Marketing spend by 5% above that of the market and competitor average
for the countries in which the Company operates.
|
|
The following Excel spreadsheets (or the Access tables in the databases) should be used to produce a graphic representation of the relationship between the Company and the industry and market situation. The links below point to the industry and market situation, and to the situation in respect of the Company:- |
|
|
INDUSTRY & MARKET |
THE TARGET COMPANY |
|
|
|
Marketing Expenditure Increase : + 2% |
Marketing Expenditure Increase : + 2% |
|
|
Marketing Expenditure Increase : + 4% |
Marketing Expenditure Increase : + 4% |
|
|
Marketing Expenditure Increase : + 6% |
Marketing Expenditure Increase : + 6% |
|
|
Marketing Expenditure Increase : + 8% |
Marketing Expenditure Increase : + 8% |
|
|
Marketing Expenditure Increase : +10% |
Marketing Expenditure Increase : +10% |
|
|
Marketing Expenditure Increase : +12% |
Marketing Expenditure Increase : +12% |
|
|
Marketing Expenditure Decrease : - 2% |
Marketing Expenditure Decrease : - 2% |
|
|
Marketing Expenditure Decrease : - 4% |
Marketing Expenditure Decrease : - 4% |
|
|
Marketing Expenditure Decrease : - 6% |
Marketing Expenditure Decrease : - 6% |
|
|
Marketing Expenditure Decrease : - 8% |
Marketing Expenditure Decrease : - 8% |
|
|
Marketing Expenditure Decrease : -10% |
Marketing Expenditure Decrease : -10% |
|
|
Marketing Expenditure Decrease : -12% |
Marketing Expenditure Decrease : -12% |
|
|
The following Excel spreadsheets (or the Access tables in the databases) should be used to produce a graphic representation of the relationship between the Company and the industry and market situation. The links below point to the industry and market situation, and to the situation in respect of the Company:- |
|
|
INDUSTRY & MARKET |
THE TARGET COMPANY |
|
|
|
+ 2% Marketing Expenditure Increase |
+ 2% Marketing Expenditure Increase |
|
|
+ 4% Marketing Expenditure Increase |
+ 4% Marketing Expenditure Increase |
|
|
+ 6% Marketing Expenditure Increase |
+ 6% Marketing Expenditure Increase |
|
|
+ 8% Marketing Expenditure Increase |
+ 8% Marketing Expenditure Increase |
|
|
+ 10% Marketing Expenditure Increase |
+ 10% Marketing Expenditure Increase |
|
|
+ 12% Marketing Expenditure Increase |
+ 12% Marketing Expenditure Increase |
|
|
- 2% Marketing Expenditure Decrease |
- 2% Marketing Expenditure Decrease |
|
|
- 4% Marketing Expenditure Decrease |
- 4% Marketing Expenditure Decrease |
|
|
- 6% Marketing Expenditure Decrease |
- 6% Marketing Expenditure Decrease |
|
|
- 8% Marketing Expenditure Decrease |
- 8% Marketing Expenditure Decrease |
|
|
- 10% Marketing Expenditure Decrease |
- 10% Marketing Expenditure Decrease |
|
|
- 12% Marketing Expenditure Decrease |
- 12% Marketing Expenditure Decrease |
PRODUCT DEVELOPMENT AND PROCESS DEVELOPMENT COSTS
The introduction of New Products and the
sustained development of Process techniques are vital to every situation
the Company will encounter in the Products & Services industry.
Long Term
profitability and growth is dependent on an on-going and viable Research and
Development programme and the Company must obviously be heedful of this
requirement.
The various components of the question of Research and
Development of New Products and New Process Techniques are of course complex
and include questions of professional and technical manpower, capital
requirements, research facilities, et cetera, and are not within the scope
of this study.
These questions must however be put and the Company must decide if they have the necessary capabilities, or if they
can organically develop the necessary capabilities or if these capabilities
can be purchased.
There is an established link between technically
and technologically superior products and successful enterprises and one
must not only consider the product and the process but also the development
of associated services, after-sales services, et cetera. The provision of
associated products and services may be as important as the provision of the
product itself.
It is assumed that the Company already use
standardized PERT and CPA procedures for their process control and
development and are also probably using a systemized New Product Screening
procedure. Obviously the more complicated the process the greater the need
for efficient review systems; in terms of Products & Services "Product Screening",
this study will seek to provide a suggested New Product Screening procedure
(found in the accompanying documentation).
The rest of this
particular section will explore the impact Product Development and Process
Development expenditures have on Profitability and other factors.
|
|
The following Excel spreadsheets (or the Access tables in the databases) should be used to produce a graphic representation of the relationship between the Company and the industry and market situation. The links below point to the industry and market situation, and to the situation in respect of the Company:- |
|
|
INDUSTRY & MARKET |
THE TARGET COMPANY |
|
Research & Product Cost Objectives |
||
|
|
||
|
|
||
Product Positioning |
||
|
|
||
|
|
||
PRODUCTS + SERVICES PROFITABILITY / DEVELOPMENT EXPENDITURE & MARKET GROWTH
|
PRODUCTS + SERVICES PROFITABILITY / DEVELOPMENT EXPENDITURE & MARKET GROWTH |
||||
|
THE TARGET COMPANY |
LONG-TERM MARKET GROWTH |
|||
|
LOW |
AVERAGE |
HIGH |
||
|
DEVELOPMENT divided by SALES |
LOWER |
ROIc=****% |
ROIc=****% |
ROIc=****% |
|
SAME |
ROIc=****% |
ROIc=****% |
ROIc=****% |
|
|
HIGHER |
ROIc=****% |
ROIc=****% |
ROIc=****% |
|
High Development Expenditure tends to be
profitable in Mature Markets with a relatively low Long Term Growth rate.
Similarly, Low Development Expenditure tends to be profitable in Dynamic
Markets with a relatively high Long Term Growth rate.
Mid-range
Development Expenditure is apparently profitable in any Market Growth
situation.
PRODUCTS + SERVICES PROFITABILITY / DEVELOPMENT EXPENDITURE & PRODUCT QUALITY
|
PRODUCTS + SERVICES PROFITABILITY / DEVELOPMENT EXPENDITURE & PRODUCT QUALITY |
||||
|
THE TARGET COMPANY |
PRODUCT QUALITY |
|||
|
LOW |
AVERAGE |
HIGH |
||
|
DEVELOPMENT divided by SALES |
LOWER |
ROIc=****% |
ROIc=****% |
ROIc=****% |
|
SAME |
ROIc=****% |
ROIc=****% |
ROIc=****% |
|
|
HIGHER |
ROIc=****% |
ROIc=****% |
ROIc=****% |
|
Mid-Range Development Expenditure appears
to be very attractive in terms of profitability if used to improve Product
Quality. Mid-Range Development Expenditure can benefit the Company,
irrespective of the existing quality of their products, if it is applied to
the improvement of Product Quality.
PRODUCTS + SERVICES PROFITABILITY / DEVELOPMENT EXPENDITURE & MARKETING COSTS
|
PRODUCTS + SERVICES PROFITABILITY / DEVELOPMENT EXPENDITURE & MARKETING COSTS |
||||
|
THE TARGET COMPANY |
MARKETING COSTS / SALES RATIOS |
|||
|
LOWER |
SAME |
HIGHER |
||
|
DEVELOPMENT divided by SALES |
LOW |
ROIc=****% |
ROIc=****% |
ROIc=****% |
|
NORMAL |
ROIc=****% |
ROIc=****% |
ROIc=****% |
|
|
HIGH |
ROIc=****% |
ROIc=****% |
ROIc=****% |
|
If Development Expenditure is low then
Marketing Costs do not seriously affect Profitability at any level.
If Development Expenditure is high then a high level of Marketing Costs will
have a drastically adverse effect on Profitability.
A Mid-Range
Development Expenditure coupled with Mid-Range Marketing Costs would appear
to produce the best Profitability figures in the long term.
PRODUCTS + SERVICES PROFITABILITY / DEVELOPMENT EXPENDITURE & MARKET SHARE
|
PRODUCTS + SERVICES PROFITABILITY / DEVELOPMENT EXPENDITURE & MARKET SHARE |
||||
|
THE TARGET COMPANY |
RELATIVE MARKET SHARE |
|||
|
LOW |
AVERAGE |
HIGH |
||
|
DEVELOPMENT divided by SALES |
LOWER |
ROIc=****% |
ROIc=****% |
ROIc=****% |
|
SAME |
ROIc=****% |
ROIc=****% |
ROIc=****% |
|
|
HIGHER |
ROIc=****% |
ROIc=****% |
ROIc=****% |
|
Profitability is very seriously damaged if Development Expenditure is
high and Market Share is low.
If Development Expenditure is high and
Market Share is also high then Profitability is considerably enhanced.
PRODUCTS + SERVICES PROFITABILITY / DEVELOPMENT EXPENDITURE & UNIONIZATION
|
PRODUCTS + SERVICES PROFITABILITY / DEVELOPMENT EXPENDITURE & UNIONIZATION |
||||
|
THE TARGET COMPANY |
UNIONIZATION |
|||
|
LOW |
AVERAGE |
HIGH |
||
|
DEVELOPMENT divided by SALES |
LOWER |
ROIc=****% |
ROIc=****% |
ROIc=****% |
|
SAME |
ROIc=****% |
ROIc=****% |
ROIc=****% |
|
|
HIGHER |
ROIc=****% |
ROIc=****% |
ROIc=****% |
|
Profitability is damaged if Development
Expenditure is high and the level of employee unionization is also high.
The level of Unionization has an uncertain affect on Profitability in the Company when it experiences a relatively low Development Expenditure.
THE TARGET COMPANY PRODUCT DISTRIBUTION
|
DEFINITIONS OF THE TARGET COMPANY MARKET CHANNELS |
|
|
Primary level |
Corporate Prime Producers |
|
Main Distribution level |
Corporate Distributors |
|
Non-retail buyer level |
Corporate Trade & Commercial Buyers |
|
Retail level |
Corporate Retailers |
|
End User level |
End Users |
|
MARKET MULTIPLIERS |
Previous |
Previous |
Last Year |
|
OEM & Manufacturers |
**** |
**** |
**** |
|
Wholesalers & Distributors |
**** |
**** |
**** |
|
Retailers & A.V.R. |
**** |
**** |
**** |
|
Users & Consumers |
**** |
**** |
**** |
|
Discount / Promotional |
**** |
**** |
**** |
Effective distribution of
Products & Services in the Trade Cell is an especially
important factor when attempting to minimize costs and thereby increase
profitability and the Company must of course fully plan distribution policy.
Distribution policy is best planned in the light of solid analysis of the
market situation and requirements in each region of each country and this is
of course the reason for the comparison of the locations of End Users and
Suppliers given earlier in this study. The data given in the comparison can
be used to formulate and develop the model required for effective
distribution planning.
The influence of both End User population and
market demand or consumption suggests the usefulness of an index number that
would be a relative measurement of the effective buying power of particular
market segments and particular geographic areas. Through such an index
distribution costs could be controlled and thereby the risk of wasted effort
and expenditure reduced.
The most useful statistic in determining
distribution (and thence sales effort) is the Buying Power Index (BPI); this
being a relative measure of consumption.
The formula for the
computation of the index is:-
|
BPI = |
5F + 3S + 2P |
|
10 |
Where,
|
BPI |
= BUYING POWER INDEX |
|
F |
= BUYING FACTOR = 100* = Percentage Change |
|
S |
= Product Group or Market Sector Consumption as a % of total consumption |
|
P |
= Customer Base as a % of the total Trade Cell Customer Base |
|
BUYING POWER INDEX |
|||||||||
|
YEAR |
2008 |
2009 |
2010 |
2011 |
2012 |
2013 |
2014 |
2015 |
... 2028 |
|
*BUYING INDEX |
**** |
**** |
**** |
**** |
**** |
**** |
**** |
**** |
**** |
* This buying factor is specific to Products & Services and should not be used for other products
The above formula can of course be easily
adapted for specific Products & Services markets or specific sectors.
For a
geographic distribution index the various components of the formula should
be specified according to the geographic coverage desired, i.e. coverage by
regions within individual countries or coverage by countries within the
Trade Cell.
|
|
The following Excel spreadsheets (or the Access tables in the databases) should be used to produce a graphic representation of the relationship between the Company and the industry and market situation. The links below point to the industry and market situation, and to the situation in respect of the Company:- |
|
|
INDUSTRY & MARKET |
THE TARGET COMPANY |
|
|
|
DISTRIBUTION & DELIVERY COST: Market
|
DISTRIBUTION & DELIVERY COST: Market
|
|
|
DISTRIBUTION & PRODUCT COST: Financials
|
DISTRIBUTION & PRODUCT COST: Financials
|
Another formula which can be used
by the Company and which is particularly useful for Products &
Services with a
relatively high process cost, a relatively infrequent purchase pattern
or a relatively fragmented customer base, is the Market Quality Index.
The importance of these factors will be discussed later in this study.
The Market Quality Index is used in the allocation of sales and
distribution resources and in the identification of areas of potentially
high sales acceptance.
The Market Quality Index is therefore a
measure of per capita (i.e. per customer) purchasing power within
specified geographic markets:-
|
MQI = |
BPI |
(100) |
|
P |
Where,
It
is recommended that the Company establish the above market patterns and
thereby ensure that there are no problems in terms of marginal costs -v-
marginal revenue.
In addition to the above formulae, there are
also other very useful and established formulae which are used in the
geographic spacing of distribution channels, physical distribution and
selling points.
DISTRIBUTION CHANNEL INVESTMENT EFFECT FORECASTS
This section analyses the effects of a Distribution Channel Improvement
programme and its inferred expenditure in terms of the Company's
Financial and Operational results.
Distribution Channel
Investments can bring almost immediate results in terms of turnover and
profitability and in general terms the investment involves both
short-term tactical projects as well as medium-term expenditure on
equipment and capital projects.
|
|
The following Excel spreadsheets (or the Access tables in the databases) should be used to produce a graphic representation of the relationship between the Company and the industry and market situation. The links below point to the industry and market situation, and to the situation in respect of the Company:- |
|
|
INDUSTRY & MARKET |
THE TARGET COMPANY |
|
|
|
DISTRIBUTION CHANNEL: Forecast
|
DISTRIBUTION CHANNEL: Forecast
|
|
|
DISTRIBUTION CHANNEL: Financials
|
DISTRIBUTION CHANNEL: Financials
|
A corner-stone of contemporary marketing strategy is the concept of
Market Share and it is precisely the tactical development of the market
share concept which will produce enhanced pre-tax profitability for the
Company.
It has for many years been an established truth
that, in the majority of cases, when a company achieves a high level of
market penetration it will also enjoy a level of profitability
considerably higher than that of its smaller competitors.
In
general it is perceived that on average a difference of 7-10% change in
market share is accompanied with a consequent variance of about 3-5%
change in pre-tax Return on Investment.
The market share /
profitability function is as evident, and indeed just as valid, in large
scale industries as it is in the smallest specialist industrial or
commercial sector. Thus the management rationale used in this study is
as valid for the Company as it is for the largest or smallest company in
the market.
Given therefore that higher profitability will accompany a high level of
market penetration, it is extremely interesting to examine and explore
exactly what the profitability / market share interaction may imply for
strategic market planning in the Company.
THE RIGHT TOOLS FOR THE JOB
There are three probable critical factors which act as catalysts in the
function between profitability and market share and before one can
examine the interaction between profitability and market share it would
perhaps be best to underline these factors and to stress to
the Company the full effects of these factors.
|
1. |
ECONOMIES OF SCALE
|
|
2. |
MARKET POWER
|
|
3. |
MANAGEMENT
|
The
above three factors critical to the profitability / market share
relationship are known to exist and are not independent of each other.
In seeking a high degree of market penetration, the Company must give
detailed consideration of these matters.
It should be a
conscious effort within the Company to develop a strategy which will
encompass all the above three ingredients of the profitability / market
share mix.
|
INDEX FOR THE TARGET COMPANY |
Previous
|
Previous |
Last Year |
|
Relative Compensation |
**** |
**** |
**** |
PERSONNEL + STAFF IMPROVEMENT EFFECT FORECASTS
|
|
The following Excel spreadsheets (or the Access tables in the databases) should be used to produce a graphic representation of the relationship between the Company and the industry and market situation. The links below point to the industry and market situation, and to the situation in respect of the Company:- |
|
|
INDUSTRY & MARKET |
THE TARGET COMPANY |
|
|
|
|
|
|
|
|
|
The Market Shares
currently held by the Company in the various Trade Cell markets have
been explored above and it is not intended that this data should be
reiterated here. What is intended is a brief dissertation on the
profitability / market share function and how this will effect
the Company. Further, it is hoped that this section will put forward a
case for the development of a rationale within the Company for the
adoption of a definite marketing strategy which will enable
the Company to harvest the fruits of the profitability / market share
equation.
There are seven important Market Share lessons for the
Company in the Products & Services market and these are discussed below:-
1. Margins & Investment Ratios
2. Purchases to Sales Ratios
3. Marketing Costs to
Sales Ratios
4.
Higher Prices -v- Higher Quality
5.
Product Leadership
6.
Frequency of Purchases
7.
Distribution of the Customer Base
MARKET SHARE & PRE-TAX PROFITABILITY
|
MARKET SHARE & PRE-TAX PROFITABILITY |
|||||||||
|
**** |
**** |
**** |
**** |
**** |
**** |
**** |
**** |
**** |
ROIc=% |
|
. |
. |
. |
. |
. |
. |
. |
. |
. |
+200% |
|
. |
. |
. |
. |
. |
. |
. |
. |
. |
+180% |
|
. |
. |
. |
. |
. |
. |
. |
. |
. |
+160% |
|
. |
. |
. |
. |
. |
. |
. |
. |
. |
+140% |
|
. |
. |
. |
. |
. |
. |
. |
. |
. |
+120% |
|
. |
. |
. |
. |
. |
. |
. |
. |
. |
+100% |
|
. |
. |
. |
. |
. |
. |
. |
. |
. |
+80% |
|
. |
. |
. |
. |
. |
. |
. |
. |
. |
+60% |
|
. |
. |
. |
. |
. |
. |
. |
. |
. |
+40% |
|
. |
. |
. |
. |
. |
. |
. |
. |
. |
+20% |
|
. |
. |
. |
. |
. |
. |
. |
. |
. |
0% |
|
. |
. |
. |
. |
. |
. |
. |
. |
. |
-20% |
|
. |
. |
. |
. |
. |
. |
. |
. |
. |
-40% |
|
. |
. |
. |
. |
. |
. |
. |
. |
. |
-60% |
|
. |
. |
. |
. |
. |
. |
. |
. |
. |
-80% |
|
. |
. |
. |
. |
. |
. |
. |
. |
. |
-100% |
|
. |
. |
. |
. |
. |
. |
. |
. |
. |
-120% |
|
. |
. |
. |
. |
. |
. |
. |
. |
. |
-140% |
|
. |
. |
. |
. |
. |
. |
. |
. |
. |
-160% |
|
. |
. |
. |
. |
. |
. |
. |
. |
. |
-180% |
|
. |
. |
. |
. |
. |
. |
. |
. |
. |
-200% |
|
-20% |
-15% |
-10% |
-5% |
+5% |
+10% |
+15% |
+20% |
+25% |
|
|
MARKET SHARE |
|||||||||
It will be noticed that there is a more or less constant increase in Products & Services profitability as market share increases.
THE RELATIONSHIP BETWEEN PRODUCTS + SERVICES MARKET SHARE, THE PROFIT TO SALES
RATIOS AND TURNOVER ON INVESTMENT
The amount of investment required to support a given volume of sales and the net profitability of those sales will, of course, determine Return on Investment. The table below shows the relationship of market share to key financial and operating ratios.
|
RATIOS: |
MARKET SHARE |
|||||
|
INDEX GIVEN: |
< 10% |
10-20% |
20-30% |
30-40% |
> 40% |
|
|
. |
CAPITAL STRUCTURE: |
. |
. |
. |
. |
. |
|
. |
Investment/Sales |
. |
. |
. |
. |
. |
|
. |
Receivables/Sales |
. |
. |
. |
. |
. |
|
. |
Inventory/Sales |
. |
. |
. |
. |
. |
|
. |
OPERATING RESULTS: |
. |
. |
. |
. |
. |
|
. |
Pre-tax Profit/Sales |
. |
. |
. |
. |
. |
|
. |
Purchases/Sales |
. |
. |
. |
. |
. |
|
. |
Manufacturing/Sales |
. |
. |
. |
. |
. |
|
. |
Marketing/Sales |
. |
. |
. |
. |
. |
|
. |
R & D/Sales |
. |
. |
. |
. |
. |
|
. |
Capacity Utilization |
. |
. |
. |
. |
. |
|
. |
PRODUCT QUALITY: |
. |
. |
. |
. |
. |
|
. |
Average % of Superior |
. |
. |
. |
. |
. |
|
. |
- minus: Inferior products |
. |
. |
. |
. |
. |
|
. |
RELATIVE PRICE: |
. |
. |
. |
. |
. |
EXHIBIT 9.1 The data has been processed through the various financial models and the Industry and Business Environment databases.
The above
shows that the essential reason for the profitability / market share
interaction as being the profound difference in pre-tax profit margins
on sales.
In general it will be observed that the ratio of
investment to sales declines only erratically with market penetration,
further that capacity utilization is not interactive with market share.
COST STRUCTURE IMPROVEMENTS EFFECT FORECASTS
This section
analyses the effects of a Cost Structure Improvement programme and its
implicit cost savings in terms of the Company's Financial and Operational
results.
Cost Structure Improvement programmes have immediate
effects on company profitability and a subsequent effect on turnover as cost
savings are reflected in prices and thus sales. There are long-term side
effects to this tactic, being that there is a tendency for such programmes
to stifle the development of New Products or improvements in marketing and
distribution.
|
|
The following Excel spreadsheets (or the Access tables in the databases) should be used to produce a graphic representation of the relationship between the Company and the industry and market situation. The links below point to the industry and market situation, and to the situation in respect of the Company:- |
|
|
INDUSTRY & MARKET |
THE TARGET COMPANY |
|
|
|
|
|
|
|
|
|
Superficially therefore, higher
investment turnover would not appear to be a critical contributing
factor to higher Return on Investment; however more detailed analysis of
the databases supports the fact that investment intensity will tend to
be directly relevant to the Company's degree of vertical integration and
the effectiveness of that vertical integration. The Company must
critically examine the degree of vertical integration to see if it is
really effective.
Vertical Integration may be measured as the
ratio of the total value added by the Company to sales. Both the
numerator and denominator of the ratio are adjusted by subtracting the
pre-tax income and adding the Products & Services industry average Return on
Investment, multiplied by the investment.
Vertical integration
will thus have a profound negative relationship to the purchases/sales
ratio and the Company should compare the purchases/sales ratio of each
product or product group to the Products & Services industry averages given
below.
THE RELATIONSHIP BETWEEN PRODUCTS + SERVICES MARKET SHARE AND ADDED VALUE
| THE RELATIONSHIP BETWEEN PRODUCTS + SERVICES MARKET SHARE AND ADDED VALUE |
|||||||||
|
CHANGE |
|||||||||
|
. |
. |
. |
. |
. |
. |
. |
. |
. |
400% |
|
. |
. |
. |
. |
. |
. |
. |
. |
. |
380% |
|
. |
. |
. |
. |
. |
. |
. |
. |
X |
360% |
|
. |
. |
. |
. |
. |
. |
X |
X |
. |
340% |
|
. |
. |
. |
. |
. |
X |
. |
. |
. |
320% |
|
. |
. |
. |
. |
. |
. |
. |
. |
. |
300% |
|
. |
. |
. |
. |
X |
. |
. |
. |
. |
280% |
|
. |
. |
. |
. |
. |
. |
. |
. |
. |
260% |
|
. |
. |
. |
X |
. |
. |
. |
. |
. |
240% |
|
. |
. |
X |
. |
. |
. |
. |
. |
. |
220% |
|
. |
X |
. |
. |
. |
. |
. |
. |
. |
200% |
|
. |
. |
. |
. |
. |
. |
. |
. |
. |
180% |
|
X |
. |
. |
. |
. |
. |
. |
. |
. |
160% |
|
. |
. |
. |
. |
. |
. |
. |
. |
. |
140% |
|
. |
. |
. |
. |
. |
. |
. |
. |
. |
120% |
|
. |
. |
. |
. |
. |
. |
. |
. |
. |
100% |
|
. |
. |
. |
. |
. |
. |
. |
. |
. |
80% |
|
. |
. |
. |
. |
. |
. |
. |
. |
. |
60% |
|
. |
. |
. |
. |
. |
. |
. |
. |
. |
40% |
|
. |
. |
. |
. |
. |
. |
. |
. |
. |
20% |
|
. |
. |
. |
. |
. |
. |
. |
. |
. |
0% |
|
5% |
10% |
15% |
20% |
25% |
30% |
35% |
40% |
45% |
|
|
% MARKET SHARE CHANGE |
|||||||||
The above data gives the average
Value Added by Market Share in the Products & Services industry (Trade Cell
average).
If the Company's added value ratios (in any particular
product group) are significantly below these figures then this
demonstrates that the Company's purchases/sales ratios are not
adequate - this being due to a lack of effective vertical integration.
It is however likely that investment turnover does in fact increase more
with market share because the high market share situations are on
average more vertically integrated than their smaller competitors. Thus,
as will be seen in the data below, for a defined degree of vertical
integration, the investment/sales ratio declines significantly, despite
the fact that averages do not.
THE EFFECT OF VERTICAL INTEGRATION ON THE INVESTMENT/SALES RATIO
|
THE EFFECT OF VERTICAL INTEGRATION ON THE INVESTMENT/SALES RATIO |
|||||||||
|
X = High Integration Y = Low Integration |
CHANGE IN |
||||||||
|
. |
. |
. |
. |
. |
. |
. |
. |
. |
100% |
|
. |
. |
. |
. |
. |
. |
. |
. |
. |
95% |
|
. |
. |
. |
. |
. |
. |
. |
. |
. |
90% |
|
. |
. |
. |
. |
. |
. |
. |
. |
. |
85% |
|
X |
. |
. |
. |
. |
. |
. |
. |
. |
80% |
|
. |
X |
X |
. |
X |
X |
. |
. |
. |
75% |
|
Y |
. |
. |
X |
. |
. |
X |
. |
. |
70% |
|
. |
Y |
. |
. |
. |
. |
Y |
X |
X |
65% |
|
. |
. |
Y |
. |
. |
. |
. |
Y |
. |
60% |
|
. |
. |
. |
. |
. |
Y |
. |
. |
Y |
55% |
|
. |
. |
. |
Y |
. |
. |
. |
. |
. |
50% |
|
. |
. |
. |
. |
Y |
. |
. |
. |
. |
45% |
|
. |
. |
. |
. |
. |
. |
. |
. |
. |
40% |
|
. |
. |
. |
. |
. |
. |
. |
. |
. |
35% |
|
. |
. |
. |
. |
. |
. |
. |
. |
. |
30% |
|
. |
. |
. |
. |
. |
. |
. |
. |
. |
25% |
|
. |
. |
. |
. |
. |
. |
. |
. |
. |
20% |
|
. |
. |
. |
. |
. |
. |
. |
. |
. |
15% |
|
. |
. |
. |
. |
. |
. |
. |
. |
. |
10% |
|
. |
. |
. |
. |
. |
. |
. |
. |
. |
5% |
|
. |
. |
. |
. |
. |
. |
. |
. |
. |
0% |
|
5% |
10% |
15% |
20% |
25% |
30% |
35% |
40% |
45% |
|
|
% MARKET SHARE CHANGE |
|||||||||
CONCLUSION
In conclusion it would appear that the best market policy
for the Company would be to pursue a strategy for increased market share for
both existing Products & Services and new products in the Trade Cell.
Separate market tactics would of course need to be applied for each
product group marketed by the Company in the Trade Cell.
Products & Services already enjoying an adequate market share should be
consolidated, whereas product groups with a limited market share would
perhaps benefit from a promotional push.
These decisions must of
course be made after suitable Gompertz analysis (to ensure that
promotional expenditure is being used on suitable product groups which
will yield the best returns) and specific strategies for individual
product groups are discussed below.
THE RELATIONSHIP OF MARKET SHARE TO THE PURCHASES/SALES RATIO FOR
PRODUCTS + SERVICES
The figures adequately demonstrates that the greater the market share
the lower the purchases to sales ratio.
High share businesses
tend to be more vertically integrated and manufacture (rather than rely
on sub-contractors and bought-in supplies) and distribute their own
products (rather than rely on third party channels of distribution). If
one therefore considers the purchase to sales ratio when weighted for
vertical integration one can readily see that a low purchase to sales
ratio is irrevocably linked to a high degree of vertical integration.
THE INVESTMENT TO SALES RATIO CORRECTED FOR VERTICAL INTEGRATION
|
THE TARGET COMPANY OPERATIONS: |
INDEX |
|
Company Operations & Activities 1 |
**** |
|
Company Operations & Activities 2 |
**** |
|
Company Operations & Activities 3 |
**** |
|
Company Operations & Activities 4 |
**** |
|
Company Operations & Activities 5 |
**** |
|
Company Operations & Activities 6 |
**** |
|
Company Operations & Activities 7 |
**** |
|
Company Operations & Activities 8 |
**** |
|
Company Operations & Activities 9 |
**** |
|
Company Operations & Activities 10 |
**** |
|
Company Operations & Activities 11 |
**** |
|
Company Operations & Activities 12 |
**** |
|
Company Operations & Activities 13 |
**** |
|
Company Operations & Activities 14 |
**** |
|
Company Operations & Activities 15 |
**** |
|
THE INVESTMENT TO SALES RATIO CORRECTED FOR VERTICAL INTEGRATION |
|||||||||
|
X = High Integration
Y = Low Integration |
CHANGE IN |
||||||||
|
. |
. |
. |
. |
. |
. |
. |
. |
. |
100% |
|
. |
. |
. |
. |
. |
. |
. |
. |
. |
95% |
|
. |
. |
. |
. |
. |
. |
. |
. |
. |
90% |
|
. |
. |
. |
. |
. |
. |
. |
. |
. |
85% |
|
. |
. |
. |
. |
. |
. |
. |
. |
. |
80% |
|
. |
. |
. |
. |
. |
. |
. |
. |
. |
75% |
|
. |
. |
. |
. |
. |
. |
. |
. |
. |
70% |
|
. |
. |
. |
. |
. |
. |
. |
. |
. |
65% |
|
. |
. |
. |
. |
. |
. |
. |
. |
. |
60% |
|
X |
. |
. |
. |
X |
. |
. |
. |
. |
55% |
|
. |
X |
. |
X |
. |
X |
. |
. |
. |
50% |
|
. |
. |
X |
. |
. |
. |
X |
. |
. |
45% |
|
. |
. |
. |
. |
. |
. |
. |
X |
. |
40% |
|
. |
. |
. |
. |
. |
. |
. |
. |
X |
35% |
|
. |
. |
. |
. |
. |
. |
. |
. |
. |
30% |
|
Y |
. |
. |
Y |
Y |
. |
. |
. |
. |
25% |
|
. |
Y |
Y |
. |
. |
Y |
Y |
Y |
. |
20% |
|
. |
. |
. |
. |
. |
. |
. |
. |
Y |
15% |
|
. |
. |
. |
. |
. |
. |
. |
. |
. |
10% |
|
. |
. |
. |
. |
. |
. |
. |
. |
. |
5% |
|
. |
. |
. |
. |
. |
. |
. |
. |
. |
0% |
|
5% |
10% |
15% |
20% |
25% |
30% |
35% |
40% |
45% |
|
|
% MARKET SHARE CHANGE |
|||||||||
Another point to note is that greater
vertical integration does not lead to an increased level of
manufacturing costs in the Products & Services industry and this probably
because these costs are offset by the increased efficiency produced in
integrated operations, thus there is no correlation between
manufacturing costs/sales and market share.
CONCLUSIONS
Any reduction made by the
Company in the purchase to sales ratio will undoubtedly increase
profitability and this can be done in a number of ways:-
|
1 |
Increased vertical integration. If the Company can increase the level of vertical integration, both upstream and downstream, then increased profitability will result. |
|
2 |
Products. As market share within the Trade Cell increases The Company should concentrate on a standardized product range, plan life cycles and product changes more accurately and aim for higher volumes and lower process costs. |
|
3 |
Equipment & Process Technology. As integration increases, the Company will be able to take advantage of equipment specialization, tooling, et cetera, and thereby make more effective use of resources. Further, the Company will be able to develop process technology and become more efficient than competitors; thus improving relative margins. |
|
4 |
Physical Process. It is essential to develop efficient CPA and PERT analysis for Products & Services processing, handling and processes in order to improve throughput time, division of labor and process rationalization as this will allow a better flow-line and thereby reduce process costs. |
|
5 |
Materials. The control of materials and supplies is a vital component in the reduction of the purchase to sales ratio and must be the subject of strict control and administration. |
|
A CHECKLIST FOR PHYSICAL PROCESS MANAGEMENT |
|||
|
FACTOR |
PERIOD |
||
|
UNITS SOLD: |
. |
. |
. |
|
MARKET SHARE: |
. |
. |
. |
|
% OF SALARIED EMPLOYEES: |
. |
. |
. |
|
WAGE RATE PER HOUR: |
. |
. |
. |
|
PURCHASE / SALES COSTS AS A %: |
. |
. |
. |
|
PHYSICAL PROCESS / SALES COSTS AS A %: |
. |
. |
. |
|
UNITS PER EMPLOYEES: |
. |
. |
. |
|
SALES PER EMPLOYEES: |
. |
. |
. |
|
FIXED ASSETS / SALES: |
. |
. |
. |
|
NUMBER OF SUPPLIERS: |
. |
. |
. |
|
PRODUCT RANGE: |
. |
. |
. |
|
DISTRIBUTION CHANNELS: |
. |
. |
. |
|
PROFIT: |
. |
. |
. |
|
ROI: |
. |
. |
. |
|
COST OF REPLACING CAPITAL EQUIPMENT: |
. |
. |
. |
The above Checklist is provided as a
guide to enable the Company to quickly and easily list the factors vital to
the process of products and services.
PRODUCTS + SERVICES MARKETING COST TO SALES RATIO AND
THE TARGET COMPANY'S TRADE CELL MARKET PENETRATION
As the Company's Trade Cell market share increases the marketing
cost/sales ratio will tend to decline. This will be due to the following
factors:-
|
1. |
Economies of Scale. Economies of Scale influence large share businesses, not only in process terms but also in the marketing of the product, through the spreading of fixed marketing costs and the more efficient utilization of marketing and sales promotion methods. |
|
2. |
Sales Promotion. A large share business is able to use its own sales effort, rather than depend on third party selling. Further, specialized sales activities can be used to promote specific products or be directed at specific customer targets. |
|
3. |
Advertising. The larger share businesses can look for a more efficient application of advertising expenditure and a lower per capita advertising cost. |
|
4. |
The Bandwagon Effect. The so called "Bandwagon Effect" will influence those products with a high degree of market penetration through greater visibility, more support from the distribution and sales channels and lower promotional costs per sale. |
CONCLUSIONS
The above items will of course be very familiar to the Company and thus need not be discussed here. Obviously any improvement in the marketing techniques used by the Company will greatly improve profitability and in this context the publishers are able to assist by making available to the Company a full range of marketing and sales promotion planning and evaluation systems and software.
THE RELATIONSHIP BETWEEN THE TARGET COMPANY TRADE CELL PRICING AND PRODUCT
QUALITY
There is a significant difference in the
Products & Services market between large
share companies and their smaller competitors and their relative retail
prices and product quality.
The Products & Services market is willing to
accept higher prices from market leaders because it is perceived that the
products from these companies will be of a higher quality. Thus market
leaders have a truly attractive competitive position and are able to
generate better margins and a higher profitability.
The market
perception of quality not only includes the physical properties and
characteristics of the product, but also the service aspects. Frequently the
service aspects are more important to customers than the actual product.
CONCLUSIONS
If the Company are seeking profitability then the
following questions must be asked:-
|
1. |
Does the Company provide their customers with value for money? |
|
2. |
Are the Company's products of good quality? |
|
3. |
Does the Company provide a quality service to customers? |
|
4. |
Does the Company's distribution channel provide their customers with value for money, a quality service, et cetera? |
|
5. |
Do the Company adequately police their distribution channels and ensure that they are not transgressing the rules of the quality -v- price relationship? |
If the answers to the above questions are in the affirmative then
the Company will undoubtedly be relatively more profitable.
|
Company Product Cost objectives
|
|||||||||||
|
ANALYSIS MARKET CONDITIONS: |
CONCLUSIONS FOR THE TARGET COMPANY: |
||||||||||
| MARKET FINDING |
FINANCIAL CONCLUSION
|
||||||||||
|
Market Definitions |
Financial Definitions |
||||||||||
THE TARGET COMPANY'S CUSTOMERS AND BETTER PRODUCTS
In contrast to the smaller
competitors in the Products & Services industry the market leaders tend to spend a
relatively higher proportion of their turnover on investing in Development
thus they are in the position of producing more advanced products.
This factor combined with product quality tends to ensure that large share
companies are not only market leaders but also product leaders.
CONCLUSIONS
The above rationale is self-evident and the
conclusions implicit here are equally evident:-
1. The need for
constant product innovation and leadership
2. The need for a programme to identify customer needs and product benefits
3. The dangers of producing "me-too" products
4. The need for an effective new product development programme
THE RELATIONSHIP BETWEEN PURCHASE FREQUENCY AND MARKET SHARE
|
INFREQUENT PURCHASE FREQUENCY |
|||||||||
|
**** |
**** |
**** |
**** |
**** |
**** |
**** |
**** |
**** |
ROIc=% |
|
. |
. |
. |
. |
. |
. |
. |
. |
. |
+200% |
|
. |
. |
. |
. |
. |
. |
. |
. |
. |
+180% |
|
. |
. |
. |
. |
. |
. |
. |
. |
. |
+160% |
|
. |
. |
. |
. |
. |
. |
. |
. |
. |
+140% |
|
. |
. |
. |
. |
. |
. |
. |
. |
. |
+120% |
|
. |
. |
. |
. |
. |
. |
. |
. |
. |
+100% |
|
. |
. |
. |
. |
. |
. |
. |
. |
. |
+80% |
|
. |
. |
. |
. |
. |
. |
. |
. |
. |
+60% |
|
. |
. |
. |
. |
. |
. |
. |
. |
. |
+40% |
|
. |
. |
. |
. |
. |
. |
. |
. |
. |
+20% |
|
. |
. |
. |
. |
. |
. |
. |
. |
. |
0% |
|
. |
. |
. |
. |
. |
. |
. |
. |
. |
-20% |
|
. |
. |
. |
. |
. |
. |
. |
. |
. |
-40% |
|
. |
. |
. |
. |
. |
. |
. |
. |
. |
-60% |
|
. |
. |
. |
. |
. |
. |
. |
. |
. |
-80% |
|
. |
. |
. |
. |
. |
. |
. |
. |
. |
-100% |
|
. |
. |
. |
. |
. |
. |
. |
. |
. |
-120% |
|
. |
. |
. |
. |
. |
. |
. |
. |
. |
-140% |
|
. |
. |
. |
. |
. |
. |
. |
. |
. |
-160% |
|
. |
. |
. |
. |
. |
. |
. |
. |
. |
-180% |
|
. |
. |
. |
. |
. |
. |
. |
. |
. |
-200% |
|
-20% |
-15% |
-10% |
-5% |
+5% |
+10% |
+15% |
+20% |
+25% |
|
|
% MARKET SHARE CHANGE |
|||||||||
There is a distinct profit advantage for
a market leader to sell relatively infrequently purchased Products &
Services
rather than those more frequently purchased. Thus, all other things being
equal, it would be more profitable for the Company to concentrate on those
product groups with a relatively lower purchase frequency.
|
FREQUENT PURCHASE FREQUENCY |
|||||||||
|
**** |
**** |
**** |
**** |
**** |
**** |
**** |
**** |
**** |
ROIc=% |
|
. |
. |
. |
. |
. |
. |
. |
. |
. |
+200% |
|
. |
. |
. |
. |
. |
. |
. |
. |
. |
+180% |
|
. |
. |
. |
. |
. |
. |
. |
. |
. |
+160% |
|
. |
. |
. |
. |
. |
. |
. |
. |
. |
+140% |
|
. |
. |
. |
. |
. |
. |
. |
. |
. |
+120% |
|
. |
. |
. |
. |
. |
. |
. |
. |
. |
+100% |
|
. |
. |
. |
. |
. |
. |
. |
. |
. |
+80% |
|
. |
. |
. |
. |
. |
. |
. |
. |
. |
+60% |
|
. |
. |
. |
. |
. |
. |
. |
. |
. |
+40% |
|
. |
. |
. |
. |
. |
. |
. |
. |
. |
+20% |
|
. |
. |
. |
. |
. |
. |
. |
. |
. |
0% |
|
. |
. |
. |
. |
. |
. |
. |
. |
. |
-20% |
|
. |
. |
. |
. |
. |
. |
. |
. |
. |
-40% |
|
. |
. |
. |
. |
. |
. |
. |
. |
. |
-60% |
|
. |
. |
. |
. |
. |
. |
. |
. |
. |
-80% |
|
. |
. |
. |
. |
. |
. |
. |
. |
. |
-100% |
|
. |
. |
. |
. |
. |
. |
. |
. |
. |
-120% |
|
. |
. |
. |
. |
. |
. |
. |
. |
. |
-140% |
|
. |
. |
. |
. |
. |
. |
. |
. |
. |
-160% |
|
. |
. |
. |
. |
. |
. |
. |
. |
. |
-180% |
|
. |
. |
. |
. |
. |
. |
. |
. |
. |
-200% |
|
-20% |
-15% |
-10% |
-5% |
+5% |
+10% |
+15% |
+20% |
+25% |
|
|
% MARKET SHARE CHANGE |
|||||||||
The reason for this is that the less
frequently purchased products tend to have a greater retail cost (because of
limited process runs and consequently higher process costs) and thus the
customer's purchase decision is more complex and calculated. This means that
customers will prefer to pay a premium for assured quality and reduce the
risk of making a mistake on a relatively more expensive product.
CONCLUSIONS
It would be beneficial for the Company, once Trade Cell market share had been built up, to
specialize on those products and product groups with a relatively
infrequent purchase pattern.
This factor also indicates that the
potentially most profitable new product development areas are those
products which are specialized and therefore are less frequently
purchased.
THE RELATIONSHIP BETWEEN CUSTOMER BASE FRAGMENTATION AND MARKET SHARE
|
FRAGMENTED CUSTOMER BASE -v- CONCENTRATED CUSTOMER BASE |
|||||||||
|
**** |
**** |
**** |
**** |
**** |
**** |
**** |
**** |
**** |
FRAGMENTED |
|
**** |
**** |
**** |
**** |
**** |
**** |
**** |
**** |
**** |
CONCENTRATED |
|
. |
. |
. |
. |
. |
. |
. |
. |
. |
+200% |
|
. |
. |
. |
. |
. |
. |
. |
. |
. |
+180% |
|
. |
. |
. |
. |
. |
. |
. |
. |
. |
+160% |
|
. |
. |
. |
. |
. |
. |
. |
. |
. |
+140% |
|
. |
. |
. |
. |
. |
. |
. |
. |
. |
+120% |
|
. |
. |
. |
. |
. |
. |
. |
. |
. |
+100% |
|
. |
. |
. |
. |
. |
. |
. |
. |
. |
+80% |
|
. |
. |
. |
. |
. |
. |
. |
. |
. |
+60% |
|
. |
. |
. |
. |
. |
. |
. |
. |
. |
+40% |
|
. |
. |
. |
. |
. |
. |
. |
. |
. |
+20% |
|
. |
. |
. |
. |
. |
. |
. |
. |
. |
0% |
|
. |
. |
. |
. |
. |
. |
. |
. |
. |
-20% |
|
. |
. |
. |
. |
. |
. |
. |
. |
. |
-40% |
|
. |
. |
. |
. |
. |
. |
. |
. |
. |
-60% |
|
. |
. |
. |
. |
. |
. |
. |
. |
. |
-80% |
|
. |
. |
. |
. |
. |
. |
. |
. |
. |
-100% |
|
. |
. |
. |
. |
. |
. |
. |
. |
. |
-120% |
|
. |
. |
. |
. |
. |
. |
. |
. |
. |
-140% |
|
. |
. |
. |
. |
. |
. |
. |
. |
. |
-160% |
|
. |
. |
. |
. |
. |
. |
. |
. |
. |
-180% |
|
. |
. |
. |
. |
. |
. |
. |
. |
. |
-200% |
|
-20% |
-15% |
-10% |
-5% |
+5% |
+10% |
+15% |
+20% |
+25% |
|
|
% MARKET SHARE CHANGE |
|||||||||
There is a profit advantage for a market
leader to sell to a relatively fragmented Products & Services customer base or
market sector. Thus, all other things being equal, it would be more
profitable for the Company to concentrate on those Trade Cell market sectors
with a relatively less concentrated customer base.
The reason for
this is that when the market is fragmented it is less perfect and thus
purchasers cannot effectively evaluate or influence retail prices.
EXPORT IMPROVEMENT + OVERSEAS DEVELOPMENT EFFECT FORECASTS
|
|
The following Excel spreadsheets (or the Access tables in the databases) should be used to produce a graphic representation of the relationship between the Company and the industry and market situation. The links below point to the industry and market situation, and to the situation in respect of the Company:- |
|
|
INDUSTRY & MARKET |
THE TARGET COMPANY |
|
Export Sales Improvement |
||
|
|
||
|
|
||
Overseas Development |
||
|
|
||
|
|
||
Because Products & Services market share has
so profound an affect on the Company's profitability, it is
essential that objectives be established for marketing strategy
which is linked to the benefits which may be derived from the market
share / profitability function.
These objectives will
obviously be interactive with other budgetary components and
considerations and the precise strategy which is chosen by the
Company will depend on the relative needs of the various
budgetary objectives at the Company.
As with the previous
section on Market Penetration, this section will base much of its
commercial rationale on the concept of the market share /
profitability relationship.
Whether the price paid for the
development of Market Penetration is a valid proposition depends on
many perceptions and predilections of individual managements. Some
of the questions to be asked include:
|
i. |
Are the Company's Trade Cell competitors too strong? |
|
ii. |
Has the Company the resources necessary to support aggressive Trade Cell marketing strategies? |
|
iii. |
Is the Company's management willing to forego short term earnings for long term growth and profitability? |
The above are only questions which
can be answered by the Company.
This report will confine
itself to three basic possibilities which the Company mana
These three strategies are:-
|
1. |
BUILDING STRATEGIES: This would involve a programme to increase market penetration by the normal means of new product introductions, improved and increased marketing activities, vertical integration, quality and product leadership, et cetera. |
|
2. |
HOLDING STRATEGIES: These are designed to maintain the status quo. |
|
3. |
HARVESTING STRATEGIES: Which are used to produce short term revenue and cash flow at the cost of long term growth and future profitability. |
If one therefore considers
the Company's existing and proposed
products and services within the context of these strategies some
guidelines will appear for the Trade Cell.
The fact that an acceptable rate of profitability is explicitly achieved through a minimum level of market penetration has been stated in this study many times. Indeed, in most markets there are minimum market penetration levels which represent a cut-off point; if the Company operates under such minimum market penetration levels (within the Trade Cell) they will undoubtedly sooner or later fail to achieve an acceptable level of profit. This perceived minimum level of market penetration is shown below for the various Trade Cell markets:-
NECESSARY LEVELS OF MARKET PENETRATION FOR PRODUCTS + SERVICES
|
INDUSTRY TRADE CELL MARKET PENETRATION CUT-OFF
|
If in the Products &
Services Trade Cell
market/s have a lower market penetration than that indicated above in any of
the Trade Cell markets then it would be best for the Company to withdraw
from those Trade Cell markets. If however the Company has a Trade Cell
market penetration equal to, or higher than, the cut-off level indicated,
but is albeit not producing a reasonable profit, then one can consider an
aggressive market push.
Building
strategies would be most useful for the newer products which are in the
Introduction or Dynamic stages of the Life Cycle.
New entrants
in the Products & Services market will of course be anticipating the short term
disadvantages of building market penetration because the normal
rationale for new entrants is that they should forego short term
benefits and invest in long term profitability. However, an industry
with many new entrants can be a dangerous and irrational battlefield and
great care must be taken by all the antagonists.
The two most
important questions for the Company to answer before considering a
Building Strategy are:-
|
i. |
Will the Company have available the necessary financial resources for such a strategy? |
|
ii. |
Will the Company be able to reinforce its push (by increasing the financial support) towards a higher level of market penetration if this is impeded by a competitor's concurrent or reciprocal push? |
If the answers to the above two
questions are negative then the Company should not contemplate a Trade
Cell Building Strategy.
BUILDING STRATEGIES FOR PRODUCTS + SERVICES MARKETS
|
BUILDING STRATEGIES FOR PRODUCTS + SERVICES MARKETS |
|||||||||
|
**** |
**** |
**** |
**** |
**** |
**** |
**** |
**** |
**** |
ROIc=% |
|
. |
. |
. |
. |
. |
. |
. |
. |
. |
+200% |
|
. |
. |
. |
. |
. |
. |
. |
. |
. |
+180% |
|
. |
. |
. |
. |
. |
. |
. |
. |
. |
+160% |
|
. |
. |
. |
. |
. |
. |
. |
. |
. |
+140% |
|
. |
. |
. |
. |
. |
. |
. |
. |
. |
+120% |
|
. |
. |
. |
. |
. |
. |
. |
. |
. |
+100% |
|
. |
. |
. |
. |
. |
. |
. |
. |
. |
+80% |
|
. |
. |
. |
. |
. |
. |
. |
. |
. |
+60% |
|
. |
. |
. |
. |
. |
. |
. |
. |
. |
+40% |
|
. |
. |
. |
. |
. |
. |
. |
. |
. |
+20% |
|
. |
. |
. |
. |
. |
. |
. |
. |
. |
0% |
|
. |
. |
. |
. |
. |
. |
. |
. |
. |
-20% |
|
. |
. |
. |
. |
. |
. |
. |
. |
. |
-40% |
|
. |
. |
. |
. |
. |
. |
. |
. |
. |
-60% |
|
. |
. |
. |
. |
. |
. |
. |
. |
. |
-80% |
|
. |
. |
. |
. |
. |
. |
. |
. |
. |
-100% |
|
. |
. |
. |
. |
. |
. |
. |
. |
. |
-120% |
|
. |
. |
. |
. |
. |
. |
. |
. |
. |
-140% |
|
. |
. |
. |
. |
. |
. |
. |
. |
. |
-160% |
|
. |
. |
. |
. |
. |
. |
. |
. |
. |
-180% |
|
. |
. |
. |
. |
. |
. |
. |
. |
. |
-200% |
|
+5% |
+10% |
+15% |
+20% |
+25% |
+30% |
+35% |
+40% |
+45% |
|
|
% MARKET SHARE CHANGE = 5% INCREASE OF ACTUAL MARKET SHARE |
|||||||||
Most companies in mature markets
adopt Holding Strategies, however the Company is in a market with
differing (Trade Cell) growth rates and product groups with relatively
spread product life cycles. Thus the question of a holding strategy for
the Company is not so simple.
A key question in adopting a
Holding Strategy and maintaining the status quo is:-
What is the most cost-effective way to maintain the (various) product
group market shares?
This will depend on several factors, amongst which are:-
|
i. |
Probabilities and Costs of technological innovation and development of products and services |
|
ii. |
Strength and Aggressiveness of the Company's Trade Cell competitors |
|
iii. |
The other market considerations mentioned above. |
The foregoing sections of this study
have implied a broad relationship between profitability and competitive
behaviour, viz,
|
iv. |
A company having quality products and services will command a premium price and thereby increase profitability in relation to their smaller competitors |
|
v. |
Market leaders will tend to spend more in terms of sales / salesforce effort, advertising and sales promotion in relation to their smaller competitors. |
In situations where the
Company have
product groups with a limited Trade Cell market share (and
the Company wish to hold this share) the most profitable Holding
Strategy is to set lower prices (than that of the competitors) and spend
proportionally less on marketing and Development.
HOLDING STRATEGIES FOR PRODUCTS + SERVICES MARKETS
|
HOLDING STRATEGIES FOR PRODUCTS + SERVICES MARKETS |
|||||||||
|
**** |
**** |
**** |
**** |
**** |
**** |
**** |
**** |
**** |
ROIc=% |
|
. |
. |
. |
. |
. |
. |
. |
. |
. |
+200% |
|
. |
. |
. |
. |
. |
. |
. |
. |
. |
+180% |
|
. |
. |
. |
. |
. |
. |
. |
. |
. |
+160% |
|
. |
. |
. |
. |
. |
. |
. |
. |
. |
+140% |
|
. |
. |
. |
. |
. |
. |
. |
. |
. |
+120% |
|
. |
. |
. |
. |
. |
. |
. |
. |
. |
+100% |
|
. |
. |
. |
. |
. |
. |
. |
. |
. |
+80% |
|
. |
. |
. |
. |
. |
. |
. |
. |
. |
+60% |
|
. |
. |
. |
. |
. |
. |
. |
. |
. |
+40% |
|
. |
. |
. |
. |
. |
. |
. |
. |
. |
+20% |
|
. |
. |
. |
. |
. |
. |
. |
. |
. |
0% |
|
. |
. |
. |
. |
. |
. |
. |
. |
. |
-20% |
|
. |
. |
. |
. |
. |
. |
. |
. |
. |
-40% |
|
. |
. |
. |
. |
. |
. |
. |
. |
. |
-60% |
|
. |
. |
. |
. |
. |
. |
. |
. |
. |
-80% |
|
. |
. |
. |
. |
. |
. |
. |
. |
. |
-100% |
|
. |
. |
. |
. |
. |
. |
. |
. |
. |
-120% |
|
. |
. |
. |
. |
. |
. |
. |
. |
. |
-140% |
|
. |
. |
. |
. |
. |
. |
. |
. |
. |
-160% |
|
. |
. |
. |
. |
. |
. |
. |
. |
. |
-180% |
|
. |
. |
. |
. |
. |
. |
. |
. |
. |
-200% |
|
+5% |
+10% |
+15% |
+20% |
+25% |
+30% |
+35% |
+40% |
+45% |
|
|
% MARKET SHARE CHANGE = 5% INCREASE OF ACTUAL MARKET SHARE |
|||||||||
3. WHEN TO HARVEST MARKET SHARE
A Harvesting Strategy is frequently not a
question of strategic choice but a matter of corporate necessity (or indeed
expediency) owing to management wishing to generate cash or dividends or to
subsidies some other operation or project.
Experience of the
Products & Services market shows that a Harvesting Strategy can only be
successfully achieved by the Company having a large Trade Cell market share
and is often the result of a counter to a change in the particular
geographic market environment due to intensified competitive activity,
rising costs, competitors' new products or innovations, et cetera. This
means that any company entering the market may find that the established
companies will attempt a Harvesting Strategy and thereby disrupt the status
quo.
Harvesting Strategies will of course only result in short term
benefits and will eventually lead to a close down of that particular market
share.
The only potential long term benefits of adopting such a
Harvesting Strategy is if it allows resources in terms of capital or
manpower to be directed towards more profitable areas or if it is used as a
tactical ploy to ensure a profitable termination of a particular product
life cycle.
HARVESTING STRATEGIES FOR PRODUCTS + SERVICES MARKETS
|
HARVESTING STRATEGIES FOR PRODUCTS + SERVICES MARKETS |
|||||||||
|
**** |
**** |
**** |
**** |
**** |
**** |
**** |
**** |
**** |
ROIc=% |
|
. |
. |
. |
. |
. |
. |
. |
. |
. |
+200% |
|
. |
. |
. |
. |
. |
. |
. |
. |
. |
+180% |
|
. |
. |
. |
. |
. |
. |
. |
. |
. |
+160% |
|
. |
. |
. |
. |
. |
. |
. |
. |
. |
+140% |
|
. |
. |
. |
. |
. |
. |
. |
. |
. |
+120% |
|
. |
. |
. |
. |
. |
. |
. |
. |
. |
+100% |
|
. |
. |
. |
. |
. |
. |
. |
. |
. |
+80% |
|
. |
. |
. |
. |
. |
. |
. |
. |
. |
+60% |
|
. |
. |
. |
. |
. |
. |
. |
. |
. |
+40% |
|
. |
. |
. |
. |
. |
. |
. |
. |
. |
+20% |
|
. |
. |
. |
. |
. |
. |
. |
. |
. |
0% |
|
. |
. |
. |
. |
. |
. |
. |
. |
. |
-20% |
|
. |
. |
. |
. |
. |
. |
. |
. |
. |
-40% |
|
. |
. |
. |
. |
. |
. |
. |
. |
. |
-60% |
|
. |
. |
. |
. |
. |
. |
. |
. |
. |
-80% |
|
. |
. |
. |
. |
. |
. |
. |
. |
. |
-100% |
|
. |
. |
. |
. |
. |
. |
. |
. |
. |
-120% |
|
. |
. |
. |
. |
. |
. |
. |
. |
. |
-140% |
|
. |
. |
. |
. |
. |
. |
. |
. |
. |
-160% |
|
. |
. |
. |
. |
. |
. |
. |
. |
. |
-180% |
|
. |
. |
. |
. |
. |
. |
. |
. |
. |
-200% |
|
+5% |
+10% |
+15% |
+20% |
+25% |
+30% |
+35% |
+40% |
+45% |
|
|
% MARKET SHARE CHANGE = 5% INCREASE OF ACTUAL MARKET SHARE |
|||||||||
HISTORIC FINANCIAL INDUSTRY DATA
STRATEGIC MARKET + FINANCIAL SCENARIOS
The STRATEGIC SCENARIOS section gives a series of Market Balance Sheet
Forecasts for the Company using a number of assumptions relating to the
strategic decisions available to the management of the Company.
The Balance sheet forecast given shows the effects of financial
improvements which Corporate Planning Management is likely to recommend:
STRATEGIC SCENARIOS
Market Share Building Objectives
Market Share Holding Objectives
Market Share Harvesting Objectives
Capital Investments Options: Process Plant & Equipment
Capital Investments Options: Premises
Capital Investments Options: Distribution / Handling
Capital Investments Options: Customer Handling Systems
Managers in the Company will, in both the
short-term and the long-term, have vital decisions to make regarding the
strategic improvements, margins and profitability and these decisions
will need to be evaluated in light of the customers, markets,
competitors, products, industry and internal factors. The scenarios
given isolate a number of the most important factors and provide balance
sheet forecasts for each of the scenarios.
|
|
The following Excel spreadsheets (or the Access tables in the databases) should be used to produce a graphic representation of the relationship between the Company and the industry and market situation. The links below point to the industry and market situation, and to the situation in respect of the Company:- |
|
|
INDUSTRY & MARKET |
THE TARGET COMPANY |
|
Market Share Building Objectives |
||
|
|
||
|
|
||
Market Share Holding Objectives |
||
|
|
||
|
|
||
Market Share Harvesting Objectives |
||
|
|
||
|
|
||
Capital Investments Options: Process Plant & Equipment |
||
|
|
||
|
|
||
Capital Investments Options: Premises |
||
|
|
||
|
|
||
Capital Investments Options: Distribution / Handling |
||
|
|
||
|
|
||
Capital Investments Options: Customer Handling Systems |
||
|
|
||
|
|
||
|
|
||
3
MARKET & PRODUCT CONSUMPTION
Market Consumption & Market Forecast figures are
given:-
|
|
Market & Product Sector Data: |
|
CURRENCY DATA: The currency figures given in this report are in U.S. Dollars.If the Windows Regional Settings on your computer is set to a non-U.S. setting then the currency symbol ($) may appear in the local currency (€, £, ¥, etc.).Either reset your Regional settings, or alternatively read all currency figures in this report as being U.S. Dollars (US$). |
|
|
CURRENCY DATA: The currency figures given in this report are in U.S. Dollars.If the Windows Regional Settings on your computer is set to a non-U.S. setting then the currency symbol ($) may appear in the local currency (€, £, ¥, etc.).Either reset your Regional settings, or alternatively read all currency figures in this report as being U.S. Dollars (US$). |
3.2
STRATEGIC PRODUCT SECTOR PROFILES
Product Profiles consists of a breakdown giving data for
each of the Products Sectors covered in the report.
|
|
Product & Industry Sector Data: |
|
CURRENCY DATA: The currency figures given in this report are in U.S. Dollars.If the Windows Regional Settings on your computer is set to a non-U.S. setting then the currency symbol ($) may appear in the local currency (€, £, ¥, etc.).Either reset your Regional settings, or alternatively read all currency figures in this report as being U.S. Dollars (US$). |
|
|
CURRENCY DATA: The currency figures given in this report are in U.S. Dollars.If the Windows Regional Settings on your computer is set to a non-U.S. setting then the currency symbol ($) may appear in the local currency (€, £, ¥, etc.).Either reset your Regional settings, or alternatively read all currency figures in this report as being U.S. Dollars (US$). |
3.3
STRATEGIC INDUSTRY SCENARIO SUMMARY
The
INDUSTRY
SUMMARY section is designed to provide for each of the Product Industry Sectors in the Long-Term.
|
|
Industry Sector Data: |
|
CURRENCY DATA: The currency figures given in this report are in U.S. Dollars.If the Windows Regional Settings on your computer is set to a non-U.S. setting then the currency symbol ($) may appear in the local currency (€, £, ¥, etc.).Either reset your Regional settings, or alternatively read all currency figures in this report as being U.S. Dollars (US$). |
|
|
CURRENCY DATA: The currency figures given in this report are in U.S. Dollars.If the Windows Regional Settings on your computer is set to a non-U.S. setting then the currency symbol ($) may appear in the local currency (€, £, ¥, etc.).Either reset your Regional settings, or alternatively read all currency figures in this report as being U.S. Dollars (US$). |
3.4
STRATEGIC FINANCIAL SUMMARY
The FINANCIAL SUMMARY section is designed to provide an
overview for each of the Product or Market Sector in the Long-Term.
|
|
Financial Data: |
|
CURRENCY DATA: The currency figures given in this report are in U.S. Dollars.If the Windows Regional Settings on your computer is set to a non-U.S. setting then the currency symbol ($) may appear in the local currency (€, £, ¥, etc.).Either reset your Regional settings, or alternatively read all currency figures in this report as being U.S. Dollars (US$). |
|
|
CURRENCY DATA: The currency figures given in this report are in U.S. Dollars.If the Windows Regional Settings on your computer is set to a non-U.S. setting then the currency symbol ($) may appear in the local currency (€, £, ¥, etc.).Either reset your Regional settings, or alternatively read all currency figures in this report as being U.S. Dollars (US$). |
|
|