|


| |
|
 |
|

|
|

The EICD and their associated
research facilities have been collecting information on Companies; their
Management and Staff; Products and Markets; Suppliers and Materials
Consumed; Bankers and Financiers; Customers and Clients and their
Competitors and Industry sectors for almost 30
years. This data is now being used to provide companies and organisations within the
European Community and EFTA with competitive information which it is hoped will help in
the development of more perfect markets - in the micro-economic sense.
In 1984 the EICD evolved
the first Financial Performance databases. The depth, scope and detail was
immediately recognised as an essential and indispensable asset for all corporate
management concerned in reviewing the financial performance and efficiency of their own
company - or that of a competitor.
Before 1989 the EICD only
provided these databases for official research purposes to other institutes and academic
bodies, for use with long-term advertising and marketing appraisal projects; however, in
1989 a policy decision was made by the Institute to make the reports commercially
available in response to the need for a more perfect world market where competitive data
is freely accessible to all those Community Companies seriously interested in financial
and operational planning.
The Financial Performance Reports
are clearly a major breakthrough for all European Community Companies seeking to evaluate
their financial performance and operational planning and enable them to quantify and
effectively analyse their own profit performance with that of their competitors. |
FINANCIAL
PERFORMANCE
Contents
|
HISTORIC
ACCOUNTS :
Introduction
Basic Company
Data
Historic Financial + Operational Data
Industry Financial Data
|
Vol. 1
|
|
TURNOVER +
REVENUE FACTORS :
Preface
Market Summary
Market Data Definitions
Markets
Product Profiles
Product Summaries
|
Vol 2
|
|
BALANCE SHEET
FORECASTS :
Base Financial + Operational
Forecast
Industry Norms
Marketing Norms
Scenarios: Financial + Operational
Marketing Expenditure Effect
New Product Expenditure Effect
Market Segmentation Expenditure Effect
New Plant + Equip Investment Effect
New Technology Investment Effect
Distribution Channel Investment Effect
Cost Structure Improvement Effect
Price Cutting Effect
Price Increase Effect
Quality Improvement Effect
Export Improvement Effect *
Personnel + Staff Improvement Effect
|
Vol 3
|
|
STRATEGIC
PERFORMANCE :
The Product
Competition
The Industry
Medium + Long Term Strategies
|
Vol 4 |
|
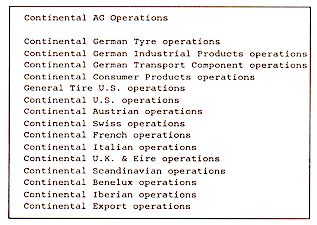
NOTE:
The figures and diagrams shown in the boxes represent example pages (or
parts of pages) from an actual report. the examples shown are from a 1991 report on
the German company Continental AG. |
|
|
FINANCIAL PERFORMANCE
Fundamental Financial
data on over 1,000,000
companies throughout the World.
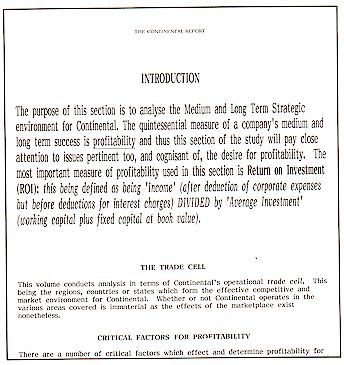
The Financial Performance Report
on a Target Company is primarily focused on the obstacles and opportunities presented to
financial executives in formulating their corporate plans. In order to expedite decision
making and planning the report provides an analysis and evaluation of all possible
consequences and perspectives confronted by the company.
The reports analyse all the
elements and aspects of the company, its finances, operations, products & services,
competitor response, markets & geographic options. This is done over time and shows
past performance, future performance prognosis and the effects of financial decisions and
expenditure on the company's sales and profits in light of, and in interaction with, the
overall financial and market conditions.
The primary aim of the reports is to implement an
exhaustive and extensive document which supplies all the data necessary to make the
fundamental financial decisions for the company.
The Financial Performance Report on a
company can probably tell you more about the Company's Financial Performance - Past and
Future - than can any other source.
|
|
Balance
The EICD Financial
Performance Reports are intended to provide a thorough assessment of the Target Company's
Financial Performance.
The objectives of these reports
and the data provided are unique and no equivalent reports presently exist elsewhere in
the world.
The Financial Performance reports
are supplied in 4 volumes comprising of about 1,500 pages.
As EICD reports are
compiled from computer databases the examination of company finances contained in these
reports is dependable and explicit and the objectivity and analysis is dramatically
superior to that of a manually produced report where one has to rely on individual
financial analysts and their opinions.
For these reasons readers state
that EICD reports are a more reliable product than that offered by ordinary
Management Consultant's or Financial Analysts reports.
EICD are currently the only Community organisation publishing hard, factual information which
will genuinely help companies overcome their financial predicaments and at the same time
encompass the advantages of the single European Union market, the integration of Eastern Europe
into the world economy and the reactions or the U.S.A., Japan and the Far Eastern
economies.
I�E�D�C E�I�C�D
�EUROPEAN INSTITUTE FOR COMMUNITY DEVELOPMENT
|
This report costs �1950 and
is available for most medium & large companies worldwide. Delivery 24 hours. |
|
|
REPORT
COVERAGE
|
|
FINANCIAL PERFORMANCE
|
|
|
REPORT COVERAGE
Historic
Accounts:- This Report covers the Balance Sheet, Profit & Loss Accounts and
Operational Costs of the company for the past three years.
Balance Sheet Forecasts:- The Report gives 13
Balance Sheet, Profit & Loss Accounts and Operational Costs Forecast Scenarios for the
company. These Scenarios represent the major financial decisions available to the company
during the next six years.
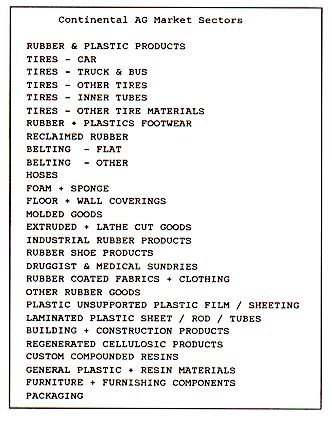
Turnover + Revenue Potential:- The Report covers up
to thirty Market Areas, Product and Market Sectors for the company. These markets
represent the main sources of the Company's Sales and Revenue.
Time Series Coverage:- Historic data covers the
years 1997 to the present and the Forecast data is shown in two time series:
a Medium-Term forecast and a Long-Range projection for the period to
2045.
|
|
Company Coverage:-
The Report covers fifteen Subsidiaries, Divisions
& Geographic Market areas for the Company. |
|
Example:
 |
|
|
Example:
 |
|
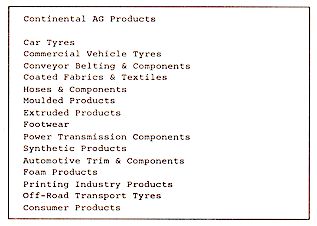
Product Coverage:-
The Report covers fifteen Product Groups and
Product Areas for the Company. |
|
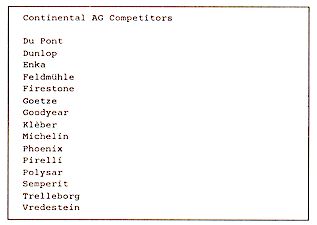
Competitor Coverage:-
The Report covers the Company's fifteen most
critical competitors in their home market plus fourteen other important national markets
within their trading area. |
|
Example:
 |
|
|
Example:
 |
|
Market Coverage:-
The Report covers up to thirty Market Areas,
Product and Market Sectors for the Company. |
|
Time Series Coverage:-
Historic data covers the years 1997 to the present
and the Forecast data is presented in two time series, being: a Medium-Term forecast
for the next 7 years and a Long-Range projection for the period to 2045. |
|
3 Time Series
|
Historic |
Current |
Long-Term |
|
From 1997 |
- |
to 2045 |
|
|
|
Volume 1 |
HISTORIC ACCOUNTS
|
|
HISTORIC ACCOUNTS
Section 1
The HISTORIC ACCOUNTS section is
designed to investigate the existing situation within the company and its Financial
performance.
This research provides much
awareness of the company and is unparalleled if the reader is endeavouring to analyse
present and past financial performance.
In addition, data is given for
the competitors in the industry and market-place so that readers can compare the company's
data with that of the competitors.
|
HISTORIC ACCOUNTS
215 pages
Basic Company Data
Historic Financial + Operational Data
Industry Financial Data |
|
Basic Company Data
Industry Financial Data *
Industry financial data given in this section is based on
reported industry accounts plus data gained from other sources as available.
|
Example:
 |
|
*
INDUSTRY FINANCIAL
DATA |
|
SALES: Gross turnover recorded, including overseas sales,
inter-group sales and exports, but excluding VAT.
DOMESTIC
SALES: Wherever applicable, domestic Sales represents the proportion of total turnover
generated locally less exports produced by the same companies.
EXPORTS: This figure will be shown where it has been
disclosed.
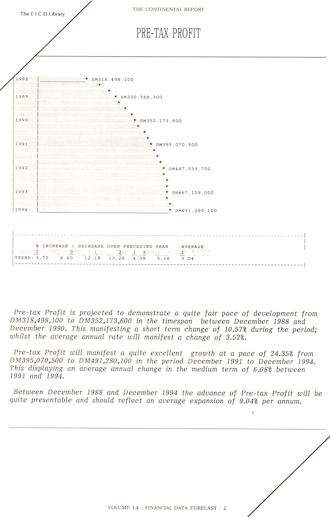
PRE-TAX PROFIT: The net trading profit figure declared
after deducting all operating expenses including depreciation and finance charges but
before deduction of tax, dividends, subventions or group relief and other appropriations.
Consolidated data is included where applicable in respect of the share of profits and
losses of associated companies. Items described by the company as exceptional are
included. Those described as extraordinary items are excluded.
INTEREST PAID: Gross interest paid. It should be noted
that many private companies either do not disclose this figure in full or aggregate
short-term, long-term and hire purchase interest together.
NON-TRADING INCOME: Comprises Investment income received,
such as income from quoted & unquoted investments, rents received, share of profit
from associated companies; as well as Reserves adjustments, such as transfers from capital
grant reserve, interest relief grants.
OPERATING PROFIT: Pre-tax profit plus interest, less
non-trading income.
DEPRECIATION: Includes amounts written off tangible fixed
assets, including leased assets.
TRADING PROFIT: Operating profit plus depreciation.
FIXED ASSETS: Property, plant, fixtures and fittings,
office equipment and motor vehicles wholly owned and shown at their written down book
value.
INTANGIBLE ASSETS: Non-tangible assets such as good will,
trade marks, patents and copyrights.
INTERMEDIATE ASSETS: Includes investments in subsidiary
and associated companies, trade investments and other unquoted investments, insurance
premiums on life policies, and Advanced Corporation Tax recoverable. In addition, amounts
due from other Group companies (as necessary), associated and affiliated companies,
receivable after one year and with no stated fixed repayment terms will be included. Long
term portions of trade and sundry debtors will also be included, wherever they are
disclosed separately in the accounts.
STOCKS: Stocks and work in progress (net of progress
repayments) held.
DEBTORS: Trade debtors and trade bills receivable due
within one year.
OTHER CURRENT ASSETS: Cash and near cash items such as
quoted investments and tax reserve certificates. In addition, sundry debtors, prepayments
and accrued income due within one year, as well as amounts due from other group companies,
associated and affiliated companies receivable within one year.
TOTAL CURRENT ASSETS: The sum of stocks, debtors and other
current assets, representing the portion of a company's assets which is realisable within
a year.
CREDITORS: Trade creditors and bills payable within one
year.
SHORT TERM LOANS: Includes short term portions of bank and
other institutions, loans, bank overdrafts, hire purchase repayments and leasing
obligations, all of which are due within one year. In addition amounts due to other group,
associated and affiliated companies payable within one year will be included.
OTHER CURRENT LIABILITIES: Sundry creditors, accrued
expenses and prepaid income including dividends, corporation tax, social security and
other sundry amounts payable within one year.
TOTAL CURRENT LIABILITIES: The sum of trade creditors,
short term debt and other current liabilities.
NET ASSETS: The net assets employed are obtained by
subtracting total current liabilities from the total assets.
SHAREHOLDERS FUNDS: The sum of issued, ordinary, and
preference share capital, all reserves, the profit and loss balance (retained profits) and
government grants.
LONG TERM LOANS: Includes long term portions of bank and
other institutional loans, mortgages, hire purchase repayments and leasing obligations,
all of which are due after on year. In addition, amounts due to other group, associated
and affiliated companies payable after one year will be included.
OTHER LONG TERM LIABILITIES: Deferred and future taxation,
minority interests, pension funds and similar liabilities, provisions for liabilities and
charges due.
CAPITAL EMPLOYED: The sum of long term liabilities. It
represents the counterpart of the net assets employed by the firm.
DIRECTORS REMUNERATION: Includes all payments made to
directors including pension fund contributions, ex-gratia payments and payments to
directors' family.
NUMBER OF EMPLOYEES AND THEIR REMUNERATION: The average
number of employees together with their aggregate wages and salaries.
WORKING CAPITAL: The short-term funding to carry out day
to day trading activities, it is obtained by subtracting total current liabilities from
the current assets.
TOTAL DEBT: This amount is obtained by adding short term
loans to the long term loans.
TOTAL LIABILITIES: The sum of capital employed and total
current liabilities.
NET WORTH: Equals shareholders funds less the intangible
assets.
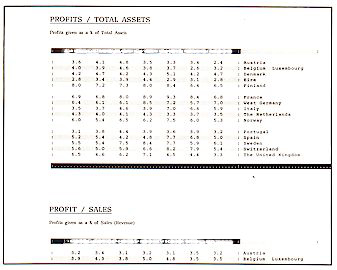
RETURN ON CAPITAL: Pre-tax profits as a percentage of
capital employed.
RETURN ON ASSETS: Pre-tax profits as a percentage of total
assets.
RETURN ON SHAREHOLDERS FUNDS: Pre-tax profits as a
percentage of shareholders funds.
PRE-TAX PROFIT MARGIN: Pre-tax profits as a percentage of
sales.
OPERATING PROFIT MARGIN: Operating profit as a percentage
of sales.
TRADING PROFIT MARGIN: Trading profit as a percentage of
sales.
ASSET UTILISATION: Sales as a ratio of total sales.
SALES/FIXED ASSETS: Sales as a ratio of fixed assets.
STOCK TURNOVER: Sales as a ratio of stocks.
CREDIT PERIOD: Debtors over sales times 365 days.
CREDITORS RATIO: Creditors over sales times 365 days.
WORKING CAPITAL/SALES: Working capital over sales.
CURRENT RATIO: Current assets as a ratio of current
liabilities.
QUICK RATIO: Current assets less stocks as a ratio of
current liabilities.
BORROWING RATIO: Total debt as a ratio of net worth.
EQUITY GEARING: Shareholders funds as a ratio of total
liabilities.
INCOME GEARING: Interest paid as a percentage of profit
before tax and before interest paid.
TOTAL DEBT/WORKING CAPITAL: Total debt as a ratio of
working capital.
DEBT GEARING RATIO: Long term loans as a ratio of net
worth.
AVERAGE REMUNERATION: Total employee remuneration divided
by the number of employees.
PROFIT/EMPLOYEES: Profit before tax divided by the number
of employees.
SALES/EMPLOYEES: Sales divided by the number of employees.
WAGES/SALES: Employee remuneration divided by sales.
FIXED ASSETS/EMPLOYEES: Fixed assets divided by the number
of employees.
EXPORTS/SALES: Exports divided by sales.
FORECAST SELLING GROWTH RATE (%/YEAR): A forecast of the
annual growth rate of the selling prices.
ROI = NET INCOME/INVESTMENT: Pre-tax net income, including
special non-recurring costs, minus corporate overhead costs, as a percentage of average
investment including fixed and working capital at book value, but excluding corporate
investment not particular to the business.
FIFO VALUATION: The accounting method used for inventory
valuation FIFO, or another method (e.g. LIFO).
FIXED CAPITAL INTENSITY: Gross book value of plant and
equipment expressed as a percentage of sales. Gross book value includes original value of
buildings, real estate manufacturing equipment and transportation equipment.
IMMEDIATE CUSTOMER FRAGMENTATION: The proportion of the
total number of immediate customers accounting for 50% of total sales, expressed as a
percentage. For example, if 5 of a business's 100 immediate customers represent 50% of the
business's sales, immediate customer fragmentation is 5%.
THE DISCOUNT CASH FLOW YIELD RATE: The internal rate of
return after tax earned in this business when this strategy is executed. It is the time
discount rate at which discounted cash flow plus residual is equal to initial
investment.
INDUSTRY CONCENTRATION RATIO: The amount of industry
shipments accounted for by the four largest firms in the industry expressed as a
percentage.
INDUSTRY (SIC) GROWTH, LONG RUN: The annual long term (10
year) growth rate of the SIC industry in which the business is located, expressed as a
percentage.
INVENTORY/SALES: The sum of raw materials, work-in-process
inventory and finished goods inventory (each net of reserve for losses) as a percentage of
sales.
INVESTMENT PER EMPLOYEE: Average investment, expressed in
monetary units per employee.
MARKET POSITION: A factor combining:
a) MARKET SHARE: the share of the served market for the
business, expressed as a percentage.
b) RELATIVE MARKET SHARE: the market share of the business
relative to the combined market share of the three leading competitors, expressed as a
percentage. For example if ones business has 30% of the market and the three largest
competitors have 20%, 10% and 10%: 30 divided by (20+10+10) = 75%.
MARKET SHARE: The share of the served market expressed as
a percentage.
RELATIVE MARKET SHARE: The market share of the business,
relative to the combined market shares of the three leading competitors, expressed as a
percentage.
RELATIVE PRODUCT QUALITY: The percentage of sales volume
from products and service that, from the perspective of the consumer, are judged as
superior to those available from leading competitors minus the percentage judged as
inferior.
RELATIVE PRICE: The average level of selling prices of the
products and service of the business relative to the average level of the leading
competitors. The average price of the competitors is 100%; if the average prices of the
business are 5% higher when its price relative to competition is 105%.
EMPLOYEES UNIONISED: The percentage of total employees of
the business who are unionised.
NEW PRODUCT SALES/SALES: Percentage of sales accounted for
by new products. New products are those products introduced during the three preceding
years.
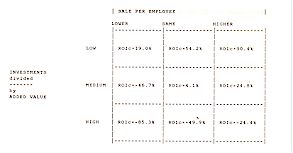
INVESTMENT/VALUE ADDED: Investment expressed as a
percentage of value added. Value added is adjusted for profits to minimise that portion of
the relationship with ROI which is caused by under or overstated earnings.
FIXED CAPITAL INTENSITY: The gross book value of plant and
equipment, expressed as a percentage of sales.
VERTICAL INTEGRATION: Value added as a percentage of
sales. Both value added and sales are adjusted for profits to minimise that portion of the
relationship with ROI which is caused by under or overstated earnings.
VALUE ADDED/EMPLOYEES: Value added (adjusted for profits)
expressed in monetary terms per employee.
CAPACITY UTILISATION: The average % percentage of standard
capacity utilised during the year. Standard capacity is the sales value of the maximum
output the business can sustain with a) facilities normally in operation and b) current
constraints (e.g. technology, work rules, labour practices, etc.) For most manufacturing
businesses this will consist of 2 shifts, 5 days per week. For process businesses a 3
shift, 6 day work week is typical.
RELATIVE INTEGRATION BACKWARD: The degree of backward
vertical integration (i.e. toward suppliers) of the business relative to its leading
competitors.
RELATIVE INTEGRATION FORWARD: The degree of forward
vertical integration (i.e. toward customers) of the business relative to its leading
competitors (less than, the same as, more than).
SELLING PRICE GROWTH RATE: The annual growth rate of
selling prices charged by the business, expressed as a percentage.
STANDARD PRODUCTS/SERVICES: The products or services of
the business more or less standardised for all customers, or are they designed or produced
to order for individual customers.
THE DISCOUNTED NET INCOME (10 YEARS): From pre-tax net
income in each year is deducted a capital charge on the increase in investment since the
base period to reflect the cost of these funds. The time discount rate is then applied to
obtain the present value of the income stream for the 10 year period.
THE DISCOUNTED CASH FLOW: The cash generated over ten
years from net income, less the cash absorbed by increases in the net investment in the
business. The annual cash flows are discounted to a present value, using the time discount
rate.
MARKET SHARE GROWTH RATE: The annual growth rate of market
share expressed as a percentage.
MARKET SHARE INSTABILITY: The instability of the market
share of the business, measured as the sum of the absolute values of the business's annual
market share changes.
NEWNESS OF P&E (NBV/GBV): Newness of plant and
equipment, measured as the ratio of net book value to gross book value.
REAL MARKET GROWTH, SHORT-RUN: The annual growth rate of
the size of served market, deflated by the selling price index, expressed as a
percentage.
RELATIVE COMPENSATION: The average of hourly wage rates
relative to leading competitors and salary levels relative to competitors. Competitors'
wage rates and salary levels are 100%; if ones wage rates and salary levels are 5% higher,
ones relative hourly wage rates are 105%, relative salaries are 105%, and ones average
relative compensation is 105%.
R&D EXPENSES/SALES: Product or Service R&D
expenses plus Process R&D expenses expressed as a percentage of sales. Product or
Service R&D expenses include all expenses incurred to secure innovation and advances
in the products or services of the business, include improvements in packaging as well as
product design, features and functions. Process R&D expenses include all expenses for
process improvements for the purpose of reducing the cost of manufacturing, processing and
physical handling of goods by the business. Sales is the net sales billed including lease
revenues of the business.
MARKETING EXPENSES/SALES: The sum of sales force,
advertising, promotion and other marketing expenses expressed as a percentage of sales. Do
not include costs of physical distribution.
INVESTMENT/SALES: Investment as a percentage of sales.
Investment can be measured in any of the following ways: a) net book value of plant and
equipment plus working capital b) equity plus long-term debt c) total assets employed
minus current liabilities attributable to the business.
REAL MARKET GROWTH RATE: The historical annual real (unit)
growth rate of the market which the business serves, expressed as a percentage.
% SHARE OF 4 LARGEST FIRMS: The combined market shares of
the four leading firms in the industry, expressed as a percentage.
% OF CUSTOMERS = 50% SALES: The best estimate of the
percentage of immediate customers accounting for 50% of the sales of the business.
PURCHASE AMOUNT IMMEDIATE CUSTOMERS: The typical amount of
products or services bought by an immediate customer in a single transaction.
SALES: The net sales billed, including lease
revenues.
ACTUAL ROI: The actual, pre-tax net income expressed as a
percentage of investment for the business, used to adjust the future estimates of
ROI.
FORECAST REAL MARKET GROWTH RATE (%/YEAR): An estimate of
the future annual real growth rate of the served market. |
|
HISTORIC FINANCIAL + OPERATIONAL DATA*
Historic Data (previous 3 years) for the company
The Financial and Operational
Data sections show each of the items listed *in terms of historic data and
covers a period of the previous 3 years. The data is given in terms of a graphic display
and a written narrative which explains the changes experienced. The graphic display uses a
standard scale which may, if required, be superimposed and/or used for audio-visual
projection purposes.
|
Example**:
 |
|
Example:
 |
|
* FINANCIAL +
OPERATIONAL DATA |
|
Total Sales; Domestic Sales; Exports; **Pre-tax
Profit; Interest Paid; Non-trading Income; Operating Profit; Depreciation; Trading Profit;
Fixed Assets; Intangible Assets; Intermediate Assets; Total Fixed Assets; Stocks; Debtors;
Other Current Assets; Total Current Assets; Total Assets; Creditors; Short Term Loans;
Other Current Liabilities; Total Current Liabilities; Net Assets; Shareholders' Funds;
Long Term Loans; Other Long Term Liabilities; Capital Employed; Directors' Remunerations;
Employees' Remunerations; Total Employees.
Order
Handling Process Expenditure; Customer Handling Process Technology Expenditure; Total
Order / Customer Handling Development Expenditure; Customer Handling Equipment in Use
within the range 0-3 years - 3-6 years - 6-9 years - 9+ years; Customer Handling Equipment
Investment greater than Depreciation - Less than Depreciation; Capital Expenditure on
Customer Handling Equipment; Capital Expenditure on Sales Offices; Capital Expenditure on
Communications.
Sales Costs; Distribution & Handling Costs;
Advertising Costs; After-Sales Costs; Total Marketing Costs; Added Value; Product Pricing
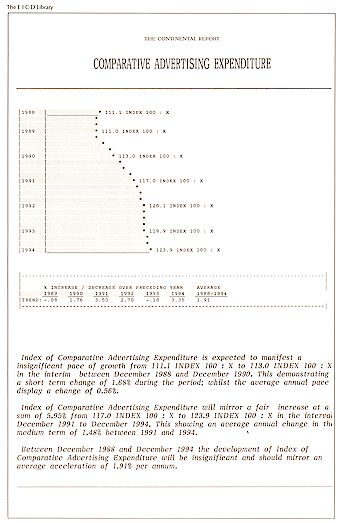
as a % of the Market Average; New Products % Total Output; Index of Comparative Salesforce
& Selling Expenditure; Index of Comparative Advertising Expenditure; Index of
Comparative General Promotional Expenditure; Customers - Wholesale - Retailer - OEM &
Manufacturing - Consumer & End User - Government.
Input Supplies / Materials and Energy Costs, Payroll
Costs, Total Operational & Process Costs, Sales Personnel Variable & Commission
Costs, Sales Expenses and Costs, Sales Materials Costs, Total Sales Costs, Distribution
Fixed Costs, Distribution Variable Costs, Warehousing Fixed Costs, Warehousing Variable
Costs, Physical Handling Fixed Costs, Physical. Handling Variable Costs, Physical Process
Fixed Costs, Physical Process Variable Costs, Total Distribution and Handling Costs,
Mailing & Correspondence Costs, Media Advertising Costs, Advertising Materials &
Print, POS & Display Costs, Exhibition & Events Costs, Total Advertising Costs,
Product Returns & Rejection Costs, Product Installation & Re-Installation Costs,
Product Breakdown & Post Installation Costs, Product Systems & Configuration
Costs, Product Service & Maintenance Costs, Customer Problem Solving & Complaint
Costs, Total After-Sales Costs, Total Marketing Costs, Total Operational Costs, New
Technology Expenditure, New Production Technology Expenditure, Research and Development
Expenditure, Capital Expenditure on Plant and Equipment, Capital Expenditure on
Structures, Capital Expenditure on Misc. Items, Total Capital Expenditure, Finished
Product Stocks, Work in Progress as Stocks, Materials as Stocks, Consumables + Supplies as
Stock, Debtors within Agreed Terms, Debtors Outside Agreed Terms, Un-recoverable Debts
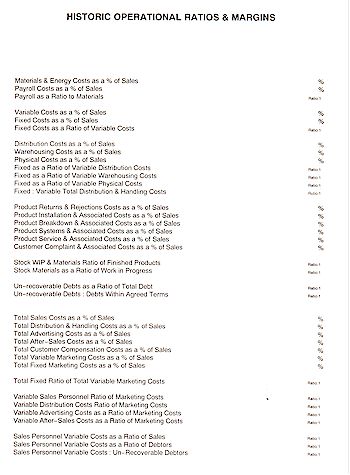
Return on Capital, Return on Assets, Return on
Shareholders' Funds, Pre-tax Profit Margins, Operating Profit Margin, Trading Profit
Margin, Return on Investment, Assets Utilization ( Sales to Total Assets ), Sales Ratio of
Fixed Assets, Stock Turnover ( Sales : ratio of Stocks ), Credit Period, Creditors' Ratio
(Creditors : Sales x 365 days), Default Debtors given (Ratio of Total Debtors,
Un-Recoverable Debts (Ratio of Total Debts, Working Capital / Sales, Materials &
Energy Costs as a % of Sales, Added Value, Investment as a Ratio of Added Value, Value of
Plant & Equipment as a % of Sales, Vertical Integration (Value Added % of Sales),
Research & Development Investment % Sales, Capital Expenditure Investment % Sales,
Marketing Costs % of Sales, Current Ratio (Current Assets : Current Liabilities), Quick
Ratio, Borrowing Ratio (Total Debt : Net Worth), Equity Ratio (Shareholders Funds :
Liabilities), Income Gearing, Total Debt as a ratio of Working Capital, Debt Gearing Ratio
(Long Term Loans : Net Worth), Average Remuneration (full and part time), Profit per
Employee, Sales per Employee, Remuneration / Sales, Fixed Assets per Employee, Capital
Employed per Employee, Total Assets per Employee, Value of Average Investment per
Employee, Value Added per Employee, Materials & Energy Costs as a % of Sales, Payroll
Costs as a % of Sales, Payroll as a Ratio to Materials, Variable Costs % of Sales, Fixed
Costs as a % of Sales, Fixed Costs as a Ratio of Variable Costs, Distribution Costs % of
Sales, Warehousing Costs % Sales, Physical Costs as a % of Sales, Fixed as a Ratio of
Variable Distribution Costs, Fixed as a Ratio of Variable Warehousing Costs, Fixed as a
Ratio of Variable Physical Costs, Fixed as a Ratio of Variable Total Distribution &
Handling Costs, Product Returns & Rejections Costs % of Sales, Product Installation
& Associated Costs as a % of Sales, Product Breakdown & Associated Costs as a % of
Sales, Product Systems & Associated Costs as a % of Sales, Product Service &
Associated Costs % of Sales, Customer Complaint & Ass. Costs % of Sales,Stock Work in
Progress & Materials : Ratio of Finished Products, Stock Materials as a Ratio of Work
in Progress, Un-recoverable Debts as a Ratio of Total Debt, Un-recoverable Debts as a
Ratio of Debts Within Terms, Total Sales Costs % of Sales, Total Distribution &
Handling Costs % of Sales, Total Advertising Costs as a % of Sales, Total After-Sales
Costs as a % of Sales, Customer Compensation Costs % of Sales, Total Variable Marketing
Costs % of Sales, Total Fixed Marketing Costs as a % of Sales, Total Fixed Marketing Costs
Ratio of Variable Marketing Costs, Variable Sales Personnel Costs as a Ratio of Marketing
Costs, Variable Distribution & Handling Ratio of Marketing Costs, Variable Advertising
Ratio of Marketing Costs, Variable After-Sales Ratio of Marketing Costs, Sales Personnel
Variable Costs : of Sales, Sales Person Variable Costs Ratio of Debts, Sales Personnel
Variable Costs Ratio of Un-Recoverable Debts, Exports as a % of Sales |
|
|
Volume 2
|
|
Volume 2 |
TURNOVER + REVENUE
FACTORS |
|
TURNOVER + REVENUE FACTORS
Section 2
The TURNOVER + REVENUE section of the report is intended
to show a historic, short-term and long-term analysis of the Turnover and Revenue
available, i.e. the Markets in which the company operates. This data is used to evaluate
and forecast the Financial performance of the Company.
It is these market appraisals which will form the basis of
the rationale of the sales and markets available to the company in the Short-Term and the
Long-Term. Historic data provided will enable readers to compare the evolution of the past
market status with the historic performance of the Company. |
TURNOVER + REVENUE FACTORS
100 pages
Preface
Market Summary
Market Data Definitions
Markets
Product Profiles
Product Summaries |
|
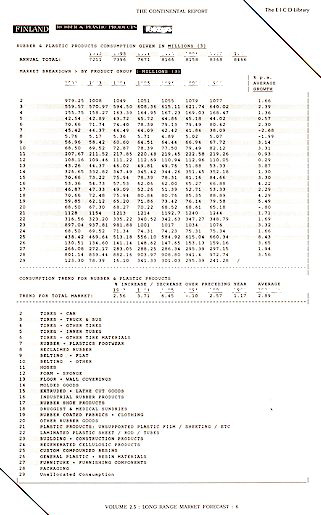
HISTORIC MARKETS
Market
Sales & Consumption data (1997 to the present) is given for each year for each country
in the Company's trading area AND by each Product in the Company's market-place.
Market Consumption and Market Trend figures are given:-
by EACH COUNTRY / STATE / REGION
by EACH PRODUCT Group and/or MARKET Sector
by YEAR from 1997
|
Example:
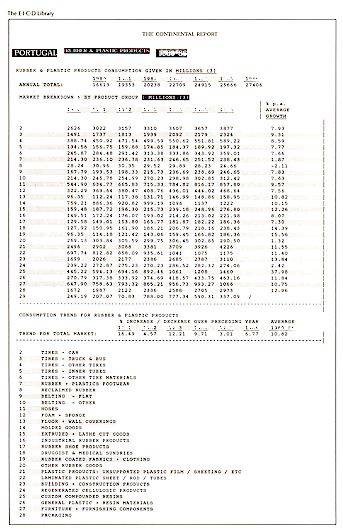 |
LONG-TERM MARKETS
This section consists of a LONG-TERM MARKET CONSUMPTION
forecast giving data for each year to the year 2045.
Market Consumption and Market Trend figures are
given:-
by EACH COUNTRY / STATE / REGION
by EACH PRODUCT Group and/or MARKET Sector
by YEAR to 2045
MARKET GROWTH RATES % Average Annual Growth
Rate to the year 2045 Given for each of 16 national markets critical to the Company.
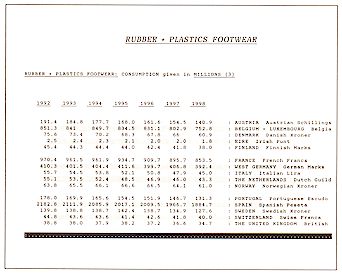
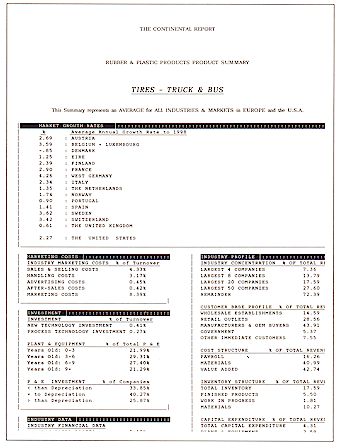
Product Profiles
Figures for Products are given
by Each country
by Each Product
by Each Year
This section provides Product Profile data for each
Product or Market sector in a matrix for all the countries or states covered by the
report.
|
Example:
 |
|
SHORT-TERM MARKETS
This
section consists of MARKET CONSUMPTION data for each year from the present
for the next 7 years.
Market Consumption and Market Trend figures are
given:-
by EACH Country / State
by EACH PRODUCT & MARKET
by YEAR
|
Example:
 |
Product Summary
Figures for Products are given
by Each country
by Each Product
This section provides Product Summary for each Product or
Market sector in a matrix for all the countries or states covered by the report in the
Present, the Medium and Long-Term.
|
Example:
 |
|
|
Volume 3 |
BALANCE SHEET
FORECASTS |
|
BALANCE SHEET FORECASTS
Section 3
The BALANCE SHEET FORECASTS section of the report gives a
series of Balance Sheet Forecasts for the company using a number of assumptions relating
to the financial decisions available to the management of the company.
The first Balance sheet forecast given is the prognosis
which assumes no change in the internal circumstances of the company. This represents the
BASE forecast and is the reference point for all the other 12 forecasts given thereafter:-
1. Base Financial + Operational Forecast *
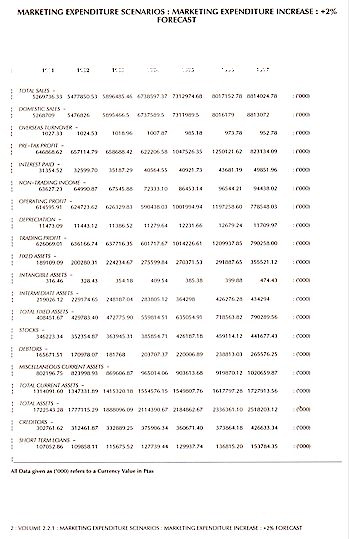
2. Marketing Expenditure Scenario *
Marketing Costs
3. New Product Expenditure Scenario *
New Product +
Product Launch Data
4. Market Segmentation Expenditure Scenario *
Market
Segmentation
5. New Plant + Equipment Investment Scenario *
New Plant +
Equipment Data
6. New Technology Investment Scenario *
New Production +
Process Technology
7. Distribution Channel Investment Scenario *
Distribution
Channel Investment
8. Cost Structure Improvement Scenario *
Cost
Structure Data
9. Price Cutting Scenario *
10. Price Increase Scenario *
11. Quality Improvement Scenario *
12. Export Improvement Scenario *
13. Personnel + Staff Improvement Scenario *
|
BALANCE SHEET FORECASTS
1205 pages
Base Financial + Operational Forecast
Industry Norms
Marketing Norms
Scenario Financial + Operational Forecasts
Marketing Expenditure Effect
New Product Expenditure Effect
Market Segmentation Expenditure Effect
New Plant + Equipment Investment Effect
New Technology Investment Effect
Distribution Channel Investment Effect
Cost Structure Improvement Effect
Price Cutting Effect
Price Increase Effect
Quality Improvement Effect
Export Improvement Effect
Personnel + Staff Improvement Effect |
|
Marketing
Marketing
Factors
Figures are given:-
by EACH COUNTRY / STATE / REGION
by YEAR.
PRODUCT FACTORS: Quality. Approvals. Design factors
/ design specifications. Physical criteria / physical parameters. R&D costs /
development costs / customisation. Technology / technology factors & development.
Product life / longevity. Performance / product efficiency / product integrity.
Reliability / product failure / product defects. Operating criteria / product operation or
usage. Probability of technical development / technical. Product life cycle / product
obsolescence.
MARKETING FACTORS: Distribution / warehousing /
handling costs. Costs/prices at supplier sale price. Costs/prices at end user / retail
sale price. Stock availability / lead times / delivery. Sales promotion & sales costs.
Advertising posture & advertising costs. Competition / competitors' aggressiveness
& posture. Market share / relative market shares. Seasonality / cyclical demand /
demand fluctuations. Sensitivity to economic climate & conditions. After-sales
factors.
SUPPLIER FACTORS: Processing / production /
handling facilities & capacity. Processing/ handling capacity / flexibility of plant.
Dependence on sub-contractors / in-house supplies. Technical capabilities / new product
developments. Technological aptitude & innovations. Other capacity. Own buying
influence / economies of scale. Alternative suppliers base. Commitment/capacity of other
suppliers. Price advantages & pricing amongst other suppliers. Conditions of sale /
terms of trading.
DISTRIBUTION / CUSTOMER INTERFACE FACTORS:
Technical / marketing capabilities & capacity. Distribution facilities & manpower
availability. Commitment to other suppliers. Sales volumes / turnover required. Margins /
added value. Captive customer base / customers handled. Area/s serviced & geographic
coverage. Sales promotion / advertising / sales force. Effects on existing products &
customer base. Cash-flow requirements of distribution channel. Capital requirements.
CUSTOMER FACTORS: Propensity to consume / demand
factors. Product purchase background / past product purchase. Purchasing criteria -
commercial. Purchasing criteria - motivational. Purchase price / acquisition costs /
product costs. DMU susceptibility / customer awareness.
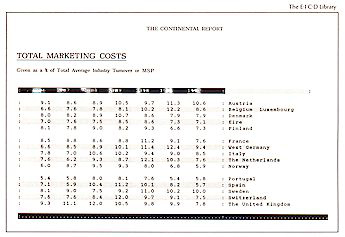
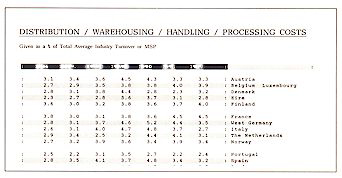
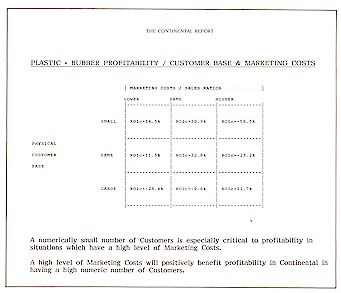
Marketing Costs Sales & selling
costs; sales & selling costs :During product launch; distribution / warehousing /
handling / processing costs; distribution / warehousing / handling / processing costs
:during product launch; advertising / promotional costs; advertising / promotional costs
:during product launch; after-sales costs; after-sales costs :product launch; total
marketing costs; total marketing costs :product launch.
MARKETING COSTS
Figures for the Products are given
by EACH COUNTRY / STATE / REGION
by YEAR to 2045:
|
Example:
 |
SALES COSTS:
Sales Personnel
Sales Personnel Expenses
Sales Materials
Distribution
Warehousing / Handling / Processing
Distribution Fixed Costs & Overheads
Distribution / Variable Costs
Warehouse / Storage Fixed Costs & Overheads
Warehouse / Storage Variable Costs
Physical Handling Fixed Costs & Overheads
Physical Handling Variable Costs
Physical Process Fixed Costs & Overheads
Physical Process Variable Costs.
|
Example:
 |
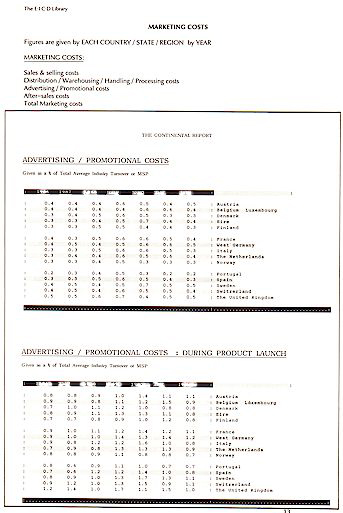
ADVERTISING / PROMOTIONAL COSTS:
Direct Mail & Direct Access
Media
Materials
POS & Distribution Channel
Advertising Materials Costs
Exhibition & Demonstration Costs.
|
Example:
 |
|
Example:
 |
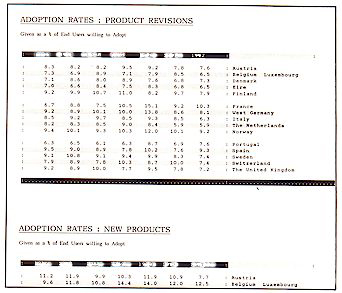
New Product + Product Launch Data
New Product Investments
New Product Expenditure in previous 3 years
New Product Technology in previous 3 years
New Product Expenditure during next 3 - 6 years
New Product Technology during next 3 - 6 years
New Product Expenditure during next 6 - 9 years
New Product Technology during next 6 - 9 years.
Product Launch / Revision Data
Adoption rates :product revisions + new products
Conversion ratios :revisions + new products
Potential 1st year growth: revisions + new products.
|
Example:
 |
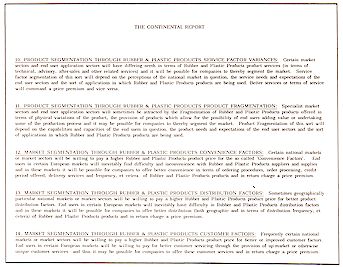
Market Segmentation
Market Segmentation
Pricing - lower price -v- higher price
Availability - greater -v- reduced availability
Convenience factors
Distribution factors
Customer factors
Psychographics
Branding
Multi-branding
Market stretching.
Product Segmentation
Higher quality
Lower quality
Performance variances
Technological & technical factors
Warranty variances
Service factor variances
Product fragmentation.
|
Example:
 |
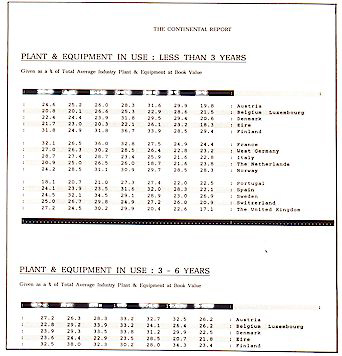
New Plant + Equipment Data
Investment:
PLANT & EQUIPMENT % of Total P & E:
Years in use: 0-3
Years in use: 3-6
Years in use: 6-9
Years in use: 9+
P & E INVESTMENT % of Companies:
Less than Depreciation
Equal to Depreciation
Greater than Depreciation.
|
Example:
 |
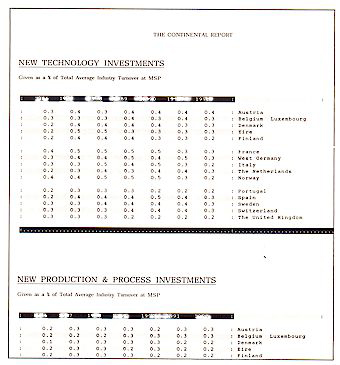
New Production + Process Technology
Industry Expenditure:
New technology investment
Process technology investment
Process technology investment in previous 3 years
Process technology investment during next: 3-6 years
Process technology investment during next: 6-9 years
Process technology investment during 9+ years
Automation technology investment in previous 3 years
Automation technology investment during next: 3-6 years
Automation technology investment during next: 6-9 years
Automation technology investment during 9+ years
|
Example:
 |
Distribution Channel Investment
Wholesale
Retail
manufacturing-OEM
Government
Public
Others immediate customers.
|
Example:
 |
Cost Structure Data
INDUSTRY EMPLOYMENT
INDUSTRY COST STRUCTURE % of total revenue:
Payroll
Materials
Value added
INVENTORY STRUCTURE % of total revenue:
Total inventory
Finished products
Work in progress
Materials
|
Example:
 |
|
BALANCE SHEET FORECASTS
The Target Company will, in both the short-term and
the long-term, have crucial decisions to make regarding investments, costs and margins and
these decisions will need to be evaluated in light of the customers, markets, competitors,
products, industry and internal factors. The scenarios given isolate 12 of the most
important factors and provide balance sheet forecasts for each of the scenarios.
The data provides a short and medium term forecast
covering the next 6 years for each of the Forecast Financial and Operational items. The
Financial and Operational Data sections show each of the items listed below in terms of
forecast data and covers a period of the next 6 years. The data is given in terms of a
graphic display and a written narrative which explains the changes experienced.
The graphic display uses a standard scale which may, if
required, be superimposed and/or used for visual projection purposes.
In addition data is given for the competitors in the
industry and market-place so that readers can compare the company's data with that of the
competitors.
This section gives a series of 13 Balance Sheet Forecasts
(covering 6 years for each item marked*) using a number of scenarios and assumptions
relating to the financial and operating decisions available to the management of the
Company.
|
1. Base Financial +
Operational Forecast * |
|
This section is designed to provide a BASE
tactical prognosis and analysis of the Target Company which is used to evaluate and
forecast short and medium term considerations and factors. The Short and Medium Term
is regarded as being the next 6 years. |
|
2. Marketing
Expenditure Effect * |
|
This section analyses the effects of a
moderate increase in Advertising and Marketing expenditure in terms of the target
company's Financial and Operational Results.
Marketing
expenditure includes Sales & Selling costs, Distribution / Warehousing / Handling /
Processing costs, Advertising / Promotional costs, After-sales costs and Total Marketing
costs.
The scenario assumes that the target company will increase
its Marketing spend by 5% above that of the market and competitor average for the
countries in which the company operates. |
|
3. New Product
Expenditure Effect * |
|
This section analyses the effects New
Products or Product Revision expenditure in terms of the target company's Financial and
Operational Results.
New Products refer to entirely
New Products or services offered to customers and Product Revisions refer to the
improvement or enhancement of existing products or services.
The scenario assumes that the target company will increase
its New Product investment by 5% above that of the industry and competitor average for the
countries in which the company operates. |
|
4. Market Segmentation
Expenditure * |
|
This section analyses the effects of a
Market Segmentation programme and its concomitant expenditure in terms of the target
company's Financial and Operational Results.
Market
Segmentation involves the repositioning, repackaging or remarketing of existing products
to meet and serve other market segments. In general terms the expenditure incurred
is limited product development costs plus additional marketing costs.
This tactic is regarded as a short or medium-term
operation where the benefits are seen in a fairly short time. |
|
5. New Plant + Equipment
Investment * |
|
This section analyses the effects of a New
Plant + Equipment Investment programme and its inherent expenditure expenditure in terms
of the target company's Financial and Operational Results.
By the very of New Plant + Equipment Investment programmes the
lead-times are extensive and the pay-back period tends to be rather protracted. the
benefits from this scenario will not be seen for some 3-5 years from inception. |
|
6. New Technology
Investment Effect * |
|
This section analyses the effects of a New
Technology Investment programme and its inferred overheads in terms of the target
company's Financial and Operational Results.
New
Technology Investment programmes are long-range investments which do not necessarily bear
fruit until year 5 or or after.
The implementation of such investment is essentially for
the long-term survival of the target company and failure in this respect reflects on the
survivability of the company. |
|
7. Distribution Channel
Investment Effect * |
|
This section analyses the effects of a
Distribution Channel Improvement programme and its likely expenditure in terms of the
target company's Financial and Operational Results.
Distribution Channel Investments can bring almost immediate results in terms
of turnover and profitability and in general terms the investment involves both short-term
tactical projects as well as medium-term expenditure on equipment and capital
projects. |
|
8. Cost Structure
Improvement Effect * |
|
This section analyses the effects of a Cost
Structure Improvement and its implicit cost savings in terms of the target company's
Financial and Operational Results.
Cost Structure
Improvements have immediate effects on company profitability and a subsequent effect on
turnover as costs savings are reflected in prices and thus sales. There are
long-term side effects to this tactic, being that there is a tendency for such programmes
to stifle the development of New Products or improvements in marketing, distribution,
staff improvements, et al. |
|
9. Price Cutting Effect * |
|
This section analyses the effects of a Price
Cutting tactic and its implied increasing turnover in terms of the target
company's Financial and Operational Results.
Price Cutting has an immediate effect on company turnover but clearly not
necessarily on profitability, at least in the short-term. There are long-term side
effects to this tactic, being that there is a danger for such action to reflect on the
quality and market position of the company.
Price Cutting tends to be a short-term remedy to sales
problems and cannot be sustained for over 2-3 years. Thus the forecasts are
pre-occupied with short-term effects. |
|
10. Price Increase Effect * |
|
This section analyses the effects of a Price
Increase tactic and its implied increasing profit margins in terms of the target
company's Financial and Operational Results.
Price
Increase has an immediate effect on company profit but evidently not on
turnover. There are long-term side effects to this tactic, being that there is
a pattern for such tactics to reflect on the market share and market placement of the
company.
Price Cutting tends to be a short-term panacea to company
problems and cannot be prolonged over 1-2 years. Thus the forecasts are pre-occupied
with short-term effects. |
|
11. Quality Improvement
Effect * |
|
This section analyses the effects of a
Quality Improvement programme and is associated expenditure in terms of the target
company's Financial and Operational Results.
Quality
Improvement involves the re-engineering, re-specification and then remarketing of existing
products or services to meet and serve more up-market segments. In general terms the
costs incurred is some product development expenditure plus additional marketing costs.
The tactic is regarded as a short or medium-term operation
where the benefits are seen in the relatively short period. |
|
12. Export Improvement
Effect * |
|
This section analyses the effects of an
Export Improvement programme and its inherent expenditure in terms of the target
company's Financial and Operational Results.
Export Improvements can bring almost instantaneous results in terms of
turnover and profitability. Generally the investment involves both short-term tactical
projects in overseas markets as well as medium-term expenditure on distribution channels
and capital establishment costs. |
|
13. Personnel + Staff
Improvement Effect * |
|
This section analyses the effects of a
Personnel + Staff Improvement and its expenditure in terms of the target
company's Financial and Operational Results.
By the very tendency of Personnel + Staff Improvement programmes the
lead-times are long and the pay-back period tends to be over 2 years. The benefits
from this scenario will not be seen for some 3-5 years from conception, yet any
company not engaged in such a programme must inevitably face long-term failure of
its
business plans. |
|
* FINANCIAL +
OPERATIONAL DATA |
|
Total Sales; Domestic Sales; Exports; Pre-tax Profit;
Interest Paid; Non-trading Income; Operating Profit; Depreciation; Trading Profit; Fixed
Assets; Intangible Assets; Intermediate Assets; Total Fixed Assets; Stocks; Debtors; Other
Current Assets; Total Current Assets; Total Assets; Creditors; Short Term Loans; Other
Current Liabilities; Total Current Liabilities; Net Assets; Shareholders' Funds; Long Term
Loans; Other Long Term Liabilities; Capital Employed; Directors' Remunerations; Employees'
Remunerations; Total Employees.
Order Handling
Process Expenditure; Customer Handling Process Technology Expenditure; Total Order /
Customer Handling Development Expenditure; Customer Handling Equipment in Use within the
range 0-3 years - 3-6 years - 6-9 years - 9+ years; Customer Handling Equipment Investment
greater than Depreciation - Less than Depreciation; Capital Expenditure on Customer
Handling Equipment; Capital Expenditure on Sales Offices; Capital Expenditure on
Communications.
Sales Costs; Distribution & Handling Costs;
Advertising Costs; After-Sales Costs; Total Marketing Costs; Added Value; Product Pricing
as a % of the Market Average; New Products % Total Output; Index of Comparative Salesforce
& Selling Expenditure; Index of Comparative Advertising Expenditure; Index of
Comparative General Promotional Expenditure; Customers - Wholesale - Retailer - OEM &
Manufacturing - Consumer & End User - Government.
Input Supplies / Materials and Energy Costs, Payroll
Costs, Total Operational & Process Costs, Sales Personnel Variable & Commission
Costs, Sales Expenses and Costs, Sales Materials Costs, Total Sales Costs, Distribution
Fixed Costs, Distribution Variable Costs, Warehousing Fixed Costs, Warehousing Variable
Costs, Physical Handling Fixed Costs, Physical. Handling Variable Costs, Physical Process
Fixed Costs, Physical Process Variable Costs, Total Distribution and Handling Costs,
Mailing & Correspondence Costs, Media Advertising Costs, Advertising Materials &
Print, POS & Display Costs, Exhibition & Events Costs, Total Advertising Costs,
Product Returns & Rejection Costs, Product Installation & Re-Installation Costs,
Product Breakdown & Post Installation Costs, Product Systems & Configuration
Costs, Product Service & Maintenance Costs, Customer Problem Solving & Complaint
Costs, Total After-Sales Costs, Total Marketing Costs, Total Operational Costs, New
Technology Expenditure, New Production Technology Expenditure, Research and Development
Expenditure, Capital Expenditure on Plant and Equipment, Capital Expenditure on
Structures, Capital Expenditure on Misc. Items, Total Capital Expenditure, Finished
Product Stocks, Work in Progress as Stocks, Materials as Stocks, Consumables + Supplies as
Stock, Debtors within Agreed Terms, Debtors Outside Agreed Terms, Un-recoverable Debts
Return on Capital, Return on Assets, Return on
Shareholders' Funds, Pre-tax Profit Margins, Operating Profit Margin, Trading Profit
Margin, Return on Investment, Assets Utilization ( Sales to Total Assets ), Sales Ratio of
Fixed Assets, Stock Turnover ( Sales : ratio of Stocks ), Credit Period, Creditors' Ratio
(Creditors : Sales x 365 days), Default Debtors given (Ratio of Total Debtors,
Un-Recoverable Debts (Ratio of Total Debts, Working Capital / Sales, Materials &
Energy Costs as a % of Sales, Added Value, Investment as a Ratio of Added Value, Value of
Plant & Equipment as a % of Sales, Vertical Integration (Value Added % of Sales),
Research & Development Investment % Sales, Capital Expenditure Investment % Sales,
Marketing Costs % of Sales, Current Ratio (Current Assets : Current Liabilities), Quick
Ratio, Borrowing Ratio (Total Debt : Net Worth), Equity Ratio (Shareholders Funds :
Liabilities), Income Gearing, Total Debt as a ratio of Working Capital, Debt Gearing Ratio
(Long Term Loans : Net Worth), Average Remuneration (full and part time), Profit per
Employee, Sales per Employee, Remuneration / Sales, Fixed Assets per Employee, Capital
Employed per Employee, Total Assets per Employee, Value of Average Investment per
Employee, Value Added per Employee, Materials & Energy Costs as a % of Sales, Payroll
Costs as a % of Sales, Payroll as a Ratio to Materials, Variable Costs % of Sales, Fixed
Costs as a % of Sales, Fixed Costs as a Ratio of Variable Costs, Distribution Costs % of
Sales, Warehousing Costs % Sales, Physical Costs as a % of Sales, Fixed as a Ratio of
Variable Distribution Costs, Fixed as a Ratio of Variable Warehousing Costs, Fixed as a
Ratio of Variable Physical Costs, Fixed as a Ratio of Variable Total Distribution &
Handling Costs, Product Returns & Rejections Costs % of Sales, Product Installation
& Associated Costs as a % of Sales, Product Breakdown & Associated Costs as a % of
Sales, Product Systems & Associated Costs as a % of Sales, Product Service &
Associated Costs % of Sales, Customer Complaint & Ass. Costs % of Sales,Stock Work in
Progress & Materials : Ratio of Finished Products, Stock Materials as a Ratio of Work
in Progress, Un-recoverable Debts as a Ratio of Total Debt, Un-recoverable Debts as a
Ratio of Debts Within Terms, Total Sales Costs % of Sales, Total Distribution &
Handling Costs % of Sales, Total Advertising Costs as a % of Sales, Total After-Sales
Costs as a % of Sales, Customer Compensation Costs % of Sales, Total Variable Marketing
Costs % of Sales, Total Fixed Marketing Costs as a % of Sales, Total Fixed Marketing Costs
Ratio of Variable Marketing Costs, Variable Sales Personnel Costs as a Ratio of Marketing
Costs, Variable Distribution & Handling Ratio of Marketing Costs, Variable Advertising
Ratio of Marketing Costs, Variable After-Sales Ratio of Marketing Costs, Sales Personnel
Variable Costs : of Sales, Sales Person Variable Costs Ratio of Debts, Sales Personnel
Variable Costs Ratio of Un-Recoverable Debts, Exports as a % of Sales |
|
|
Volume 4
|
|
Volume 4 |
STRATEGIC LONG-TERM
FACTORS |
|
LONG-TERM STRATEGY
This
section gives a far reaching strategic performance appraisal of the Company in the medium
and long term.
The Company's Product Strategies
The Company's Competition Strategies
The Company's Industry Strategies
Company's Medium + Long Term Strategies |
STRATEGIC LONG-TERM PERFORMANCE
215 pages
The Product
Competition
The Industry
Medium + Long Term Strategies
|
|
THE MARKET ENVIRONMENT
There are four basic issues to investigate when
considering the marketing environment for a Target Company
Market Growth (both short-term and medium term) by
each Product and Market Area is fully evaluated. The historic market data is presented
in Volume 2.
The Market Structure for the Target Company
products is very critical for profitability.
Market/s Serviced is the term used to denote the
function between the product/s and services offered by the Target Company and the
particular market sector which the marketing effort reaches. The Market Serviced is the
true market for the Target Company in terms of product/s and services.
The Trading Area The Market analysis provides
data in terms of the Target Company's operational . This being the regions, countries or
states which form the effective competitive and market environment for the Target Company.
Whether or not the Target Company operates in the various areas covered is immaterial as
the effects of the Market-Place exist nonetheless.
BASIS OF MARKET COVERAGE
Reports give coverage of all the
Major Products and Markets supplied and serviced by the Target Company. The reported
Target Company Markets are those which are perceived to be the most important area for the
Target Company in the Medium and Long Term.
It is felt important to concentrate only on those markets
which represent the corner-stones of the Target Company's customer base and not become
involved in any peripheral activities of the Target Company.
Market coverage is designed to encompass not only the
existing markets for the Target Company products, but also areas of market expansion,
product segmentation, parallel markets, et al. By the same token the data excludes those
market areas or sectors which are unavailable to the Target Company for whatever technical
or commercial reasons.
The Product
1. Life Cycles & Stages in the Life Cycle &
Gompertz Analysis - Market Share & the product life cycle - Quality & the
product life cycle - Product range & introduction or dynamic Stage life cycles -
Product Range & Capital Intensiveness - Market Share & selling customised or
specified products - Profitability, market share & Product uniqueness
2. Relative Pricing
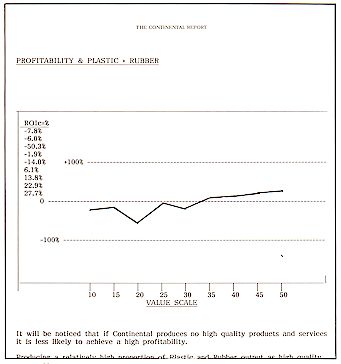
3. Quality - Value Scale - Relative Product Quality
- Profitability & Quality Products & Services - Relative Product Quality &
Levels of Profitability - Quality Profits & Concentrated Markets - Product Quality
& Relative Market Share - Product Quality, Profitability & Growth
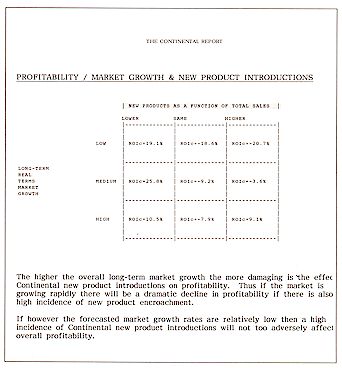
4. New Products - Profitability, growth markets
& new products - New product introductions, pricing & profitability - New product
introductions, investment & profitability - Levels of new products, product quality
& profitability
|
Example:
 |
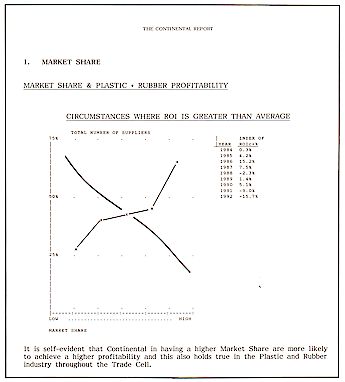
Competition
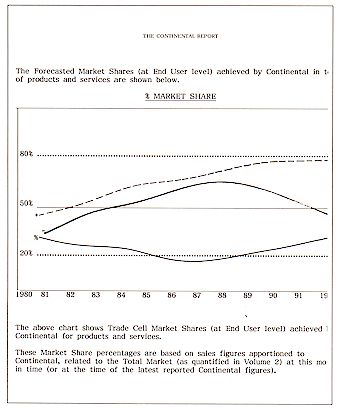
1.The Market Share - Market share &
profitability - Profitability & relative market share - Company Market Shares
|
Example:
 |
2. Relative Market Shares
|
Example:
 |
3. Nature of the Competitive Situation - Entry
& exit of competitors - Relative Strengths of competitors.
4. Perfectness of the Market
|
Example:
 |
Marketing Effect on Market Performance
Market Share (consisting of a breakdown giving data for
each year from 1997-2045) is analyzed in this section in terms of the Market Share
Effect of increases or decreases of advertising and marketing expenditure.
Market Share Changes and Market Share Trend figures are
given:-
by 10 ranges +1% to +10% increase in Advertising
+ Marketing Expenditure
by 5 ranges of -1% to -5% decrease in
Advertising + Marketing Expenditure
by EACH PRODUCT Group and/or MARKET Sector
by YEAR 1997 to the present
|
Example:
 |
Historic Effect on Market Share Performance
Market Share Changes and Market Share Trend figures are given
by 10 ranges of +1% to +10% increase
and by 5 ranges of -1% to -5% decrease in Advertising +
Marketing Expenditure:-
by EACH PRODUCT Group and/or MARKET Sector
/
by YEAR, 1997 to the present. [2]
Marketing Effect on Product Penetration
Figures for Products are given
by Each country
by Each Product
by Each Year (1997-2045)
This section provides Product Penetration data for each
Product or Market sector in a matrix for all the countries or states covered by the
report.
Marketing Effect on Market Share
Market Share (consisting of a breakdown giving data for
each year from 1997-2045) is analyzed in this section in terms of the Market Share
Effect of increases or decreases of advertising and marketing expenditure.
Market Share Changes and Market Share Trend figures are
given:-
by 10 ranges +1% to +10% increase in Marketing
Expenditure
by 5 ranges of -1% to -5% decrease in Marketing
Expenditure
by EACH PRODUCT Group and/or MARKET Sector
by YEAR to 2045
|
Example:
 |
|
|
Example:
 |
The Industry
1. Long Term Industry Growth
2. Physical Process Considerations
Costs & market shares - Capacity Utilisation & market
shares - Productivity & profitability in growth markets - Levels of labour
Unionisation & market shares - Unionisation, profitability & growth -
Unionisation, profitability & concentration - Unionisation, profitability &
harvesting strategies - Profitability, processes & market shares.
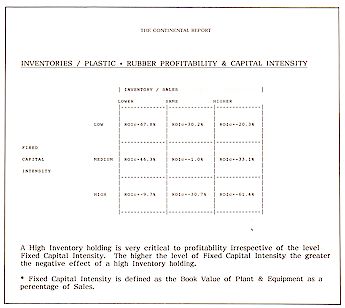
3. Capital Structure & Investment Intensity
Profitability & investment intensity - Net margins &
investment - Gross margins & investment - Profitability, market share & capital
intensity - Productivity, profitability & investment intensity - Capacity Utilisation,
profitability & capital intensity - Inventories level, profitability & capital
intensity.
|
Example:
 |
4. Physical Process & Vertical Integration
Profitability, market share & vertical integration -
Profitability, diversification & vertical integration - Profitability, vertical
integration & numbers of customers - Profitability, vertical integration & product
quality - Profitability, vertical integration & inventory value - Profitability,
vertical integration & employee productivity.
5. Marketing & Sales Costs
Profitability, market share & marketing costs -
Profitability, capital intensity & marketing costs - Profitability, numbers of
customers & marketing costs - Profitability, product quality & marketing costs -
Profitability, new products & marketing costs.
6. R&D + Process Development Costs
Profitability, R&D expenditure & market cycle -
Profitability, R&D expenditure & product quality - Profitability, R&D spend
& marketing costs - Profits, R&D spend & market share - Profitability, R&D
spend & Unionisation.
7. Distribution of the Company's Products
8. Market Penetration & The Right Tools for the Job
9. Market Share & the Company
he relationship between market share & profitability:-
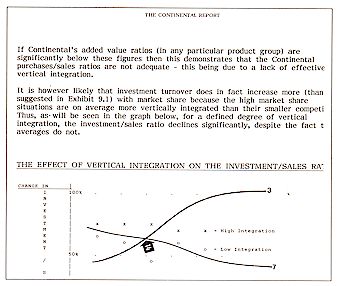
a) Market share, profit/sales & investment. The
relationship between market share & added value / Vertical integration &
investment/sales - Conclusions for the Company
b) The relationship of market share & sales ratios /
investment/sales ratio & integration - Conclusions for the Company
c) Marketing costs/sales ratio & market penetration
d) Market leadership, pricing & product quality
e) Market leadership, customers & product advances
f) Purchase frequency & Market Share
g) Customer base fragmentation & Market Share
New Product Data:
INDUSTRY EXPENDITURE New Product and Product Revision
Expenditure is given by EACH COUNTRY / STATE / REGION by YEAR.
Medium & Long-Term Strategies + Checklist
Building, Holding and Harvesting Strategies:-
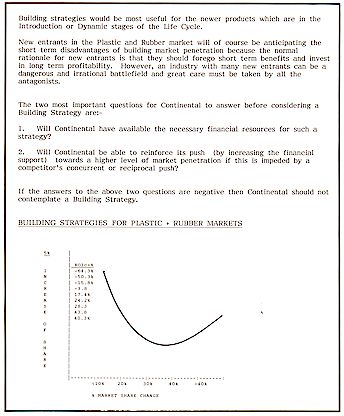
1. When to Build Market Share - Building strategies for
the company
2. When to Hold Market Share - Holding strategies for the
company
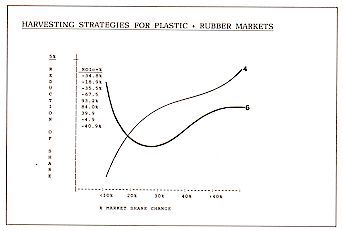
3. When to Harvest Market Share - Harvesting Strategies
for the Company
|
Example:
|
MEDIUM + LONG TERM CHECKLIST
This section recommends a working plan or document for the
critical factors which influence the company in strategic terms. The data is given as a
matrix by Subsidiary, Division, Unit or Market sector.
Medium & Long Term Checklist for the company
Forecast of Profitability ~ Forecast of Productivity ~
Forecast of Market Shares ~ Recommendations on Customer Awareness ~ Recommendations on
Customer Perceptions ~ Recommendations on Sales Promotion Activity ~ Recommendations on
Advertising Posture ~ Recommendations on Product Availability ~ Recommendations on
Technical Competence ~ Recommendations on Awareness of Products ~ Recommendations on
Awareness of Product Quality ~ Recommendations on Awareness of Product Pricing ~
Recommendations on Pricing Relative to Competitors ~ Recommendations on Quality Relative
to Competitors ~ Recommendations on Relative Product Performance ~ Recommendations on
Relative Technical Superiority ~ Recommendations on Relative Service Factors ~ Forecast of
Current Customer Base ~ Forecast of Annual Sales of Products & Services ~ Forecast of
Current Sales ~ Recommended Costs & Margins ~ Recommended Distribution Channels &
Networks ~ Forecast of Pre-Tax Profit / Total Assets ~ Forecast of Pre-Tax Profit / Sales
~ Forecast of Pre-Tax Profit / Capital Employed ~ Forecast of Pre-Tax Profit Per Employee
~ Forecast of Investment / Sales ~ Forecast of Receivables / Sales ~ Forecast of Inventory
/ Sales ~ Forecast of Physical Process Costs / Sales ~ Forecast of Total Marketing Costs /
Sales ~ Forecast of R&D Expenditure / Sales ~ Forecast of Added Value ~ Forecast of
Capacity Utilisation ~ Forecast of Relative Product Quality ~ Forecast of Relative Product
Pricing ~ Forecast of Competitors ~ Forecast of Competitors' Strength ~ Forecast of New
Products ~ Forecast of Product Life Cycles ~ Forecast of New Product Horizons ~ Forecast
of Relative Competitive Sales-Force Expenditure ~ Forecast of Relative Competitive
Advertising Expenditure ~ Forecast of Relative Competitive Promotional Expenditure.
|
Example:
 |
NEW PRODUCT DEVELOPMENT + PRODUCT SCREENING
The report will provide a fully developed product screening
procedure for the future use of readers when evaluating existing products and new product
opportunities for the company.
|
Example:
 |
|
Example:
 |
Life Cycles: Relative Pricing: Quality: New Products:
Market Share: Relative Market Shares: Nature of the Competitive Situation: Perfectness of
the Market: Long Term Industry Growth: Marketing & Sales Costs: Distribution of
Company Products: Market Penetration & The Right Tools for the Job: Market Share &
relationship / market share & profitability: Market share, profit/sales &
investment: Relationship / market share & added value / Vertical integration &
investment/sales: Relationship of market share & sales ratios / investment/sales ratio
& integration: Marketing costs/sales ratio & market penetration: Market
leadership, pricing & product quality: Market leadership, customers & product
advances: Purchase frequency & Market Share: Customer base fragmentation & Market
Share: Strategies - Build - Hold - Harvest. |
|
 EUROPEAN INSTITUTE FOR COMMUNITY DEVELOPMENT